
Page 433 - Excel for Scientists and Engineers: Numerical Methods
P. 433
-30 L
X
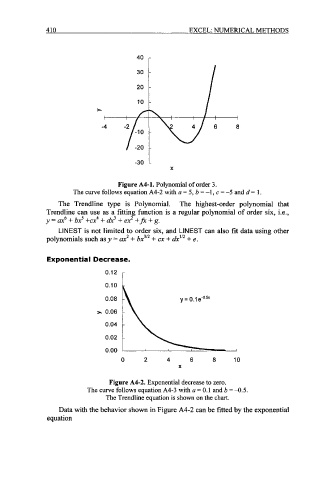
Figure A4-1. Polynomial of order 3.
The curve follows equation A42 with a = 5, b = -1, c = -5 and d = 1.
The Trendline type is Polynomial. The highest-order polynomial that
Trendline can use as a fitting function is a regular polynomial of order six, i.e.,
y = ax6 + bx5 +cx4 + ak3 + ex2 +fx + g.
LINEST is not limited to order six, and LINEST can also fit data using other
polynomials such as y = ax2 + bx3'2 + cx + + e.
Exponential Decrease.
0.1 0
0.08
*, 0.06
0.04
0.02
0.00
0 2 4 6 8 10
X
Figure A4-2. Exponential decrease to zero.
The curve follows equation A43 with a = 0.1 and b = -0.5.
The Trendline equation is shown on the chart.
Data with the behavior shown in Figure A4-2 can be fitted by the exponential
equation