
Page 438 - Excel for Scientists and Engineers: Numerical Methods
P. 438
APPENDIX 4 EQUATIONS FOR CURVE FITTING 415
The Trendline type is Logarithmic.
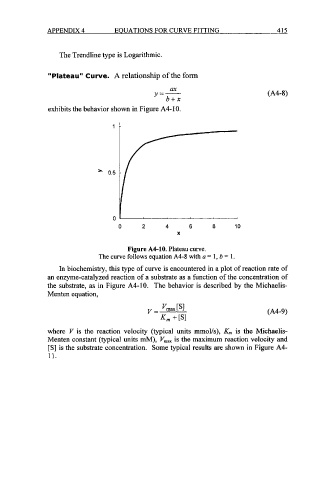
"Plateau" Curve. A relationship of the form
y=- ax (A4-8)
b+x
exhibits the behavior shown in Figure A4-10.
1
>r 0.5
0
0 2 4 6 8 10
X
Figure A4-10. Plateau curve.
The curve follows equation A4-8 with a = 1, b = 1.
In biochemistry, this type of curve is encountered in a plot of reaction rate of
an enzyme-catalyzed reaction of a substrate as a function of the concentration of
the substrate, as in Figure A4-10. The behavior is described by the Michaelis-
Menten equation,
(A4-9)
where V is the reaction velocity (typical units mmol/s), K,,, is the Michaelis-
Menten constant (typical units mM), V,, is the maximum reaction velocity and
[S] is the substrate concentration. Some typical results are shown in Figure A4-
11.