Page 440 - Excel for Scientists and Engineers: Numerical Methods
P. 440

APPENDIX 4          EQUATIONS FOR CURVE FITTING                      417


                                0.00 '


                                     0              5            10
                                                     WSI
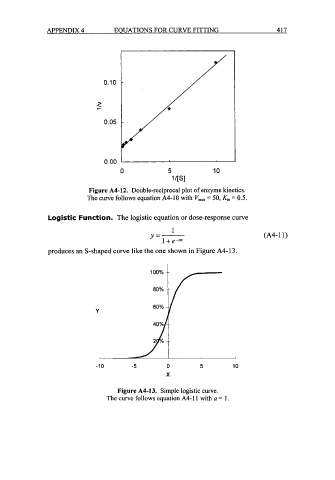
                            Figure A4-12.  Double-reciprocal plot of enzyme kinetics.
                           The curve follows equation A4-10 with V,,,  = 50, K,,, = 0.5.


                Logistic Function.  The logistic equation or dose-response curve
                                                     1
                                              y=-                               (A4-11)
                                                  1 + e-"
                produces an S-shaped curve like the one shown in Figure A4-13.


                              Y


                              -10        -5        0         5         10
                                                   X

                                    Figure A4-13.  Simple logistic curve.
                                 The curve follows equation A4- 1 1 with a = 1.
   435   436   437   438   439   440   441   442   443   444   445