
Page 442 - Excel for Scientists and Engineers: Numerical Methods
P. 442
APPENDIX 4 EQUATIONS FOR CURVE FITTING 419
Figure A4-15. Logistic curve with additional variables.
The curve follows equation A4-12 with a = 1, b = 0.5 and c = 5.
Logistic Curve with Offset on the y-Axis. The logistic equation
(A4- 13)
-10 -5 0 5 10 15 20
A
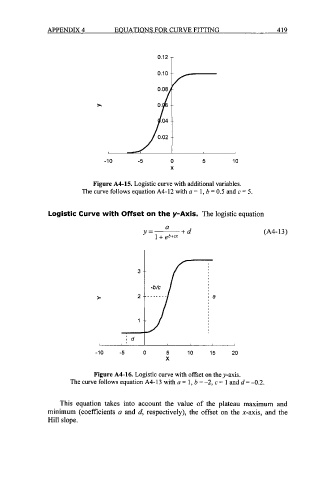
Figure A4-16. Logistic curve with offset on the y-axis.
The curve follows equation A4-13 with a = 1, b = -2, c = 1 and d = -0.2.
This equation takes into account the value of the plateau maximum and
minimum (coefficients a and d, respectively), the offset on the x-axis, and the
Hill slope.