Page 437 - Excel for Scientists and Engineers: Numerical Methods
P. 437

4 14                                       EXCEL: NUMERICAL METHODS


                                                 y= 1.1x-O.~


                                   0       2      4      6      8      10
                                                      X

                                        Figure A4-8. Power curve.
                             The curve follows equation A4-6 with a = 1.1, b = -0.5.
                                 The Trendline equation is shown on the chart.
                   The linearized form of equation A4-6 is In y  = b In x + In  a; the Trendline
               form is Power.


               Logarithmic.


                                4

                                2                      y = 2Ln(x) + 1


                              -0                                        I
                                                                       10
                                -2

                                “t


                                -6
                                                     X

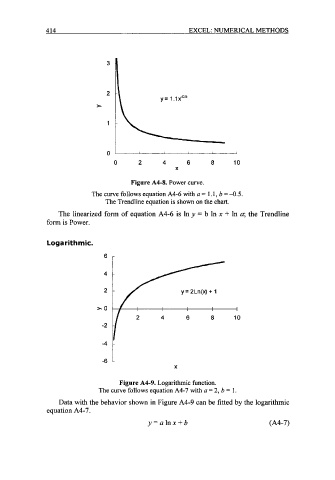
                                     Figure A4-9. Logarithmic function.
                               The curve follows equation A4-7 with a = 2, b = 1.

                   Data with the behavior shown in Figure A4-9 can be fitted by the logarithmic
               equation A4-7.
                                             y = a lnx + b                        (A4-7)
   432   433   434   435   436   437   438   439   440   441   442