
Page 435 - Excel for Scientists and Engineers: Numerical Methods
P. 435
412 EXCEL: NUMERICAL METHODS
1
0.8
0.6
x
0.4
0.2
0
0 2 4 6 8 10
X
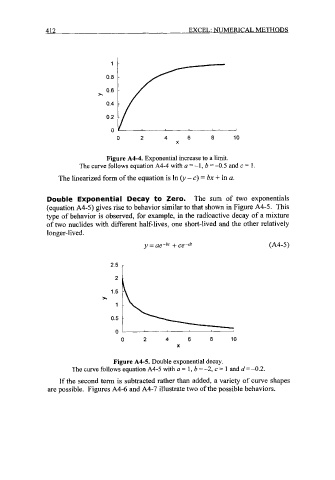
Figure A4-4. Exponential increase to a limit.
The curve follows equation A4-4 with a = -1, b = -0.5 and c = 1.
The linearized form of the equation is In 0, - c) = bx + In a.
Double Exponential Decay to Zero. The sum of two exponentials
(equation A4-5) gives rise to behavior similar to that shown in Figure A4-5. This
type of behavior is observed, for example, in the radioactive decay of a mixture
of two nuclides with different half-lives, one short-lived and the other relatively
longer-lived.
y = ae-bt + ce-dl (A4-5)
21
1.5
>r
>r
o.q\
0 , ,
0
0 2 4 6 8 10
X
Figure A4-5. Double exponential decay.
The curve follows equation A4-5 with a = 1, b = -2, c = 1 and d = -0.2.
If the second term is subtracted rather than added, a variety of curve shapes
are possible. Figures A4-6 and A4-7 illustrate two of the possible behaviors.