
Page 252 - Facility Piping Systems Handbook for Industrial, Commercial, and Healthcare Facilities
P. 252
HEAT TRANSFER, INSULATION, AND FREEZE PROTECTION
5.36 CHAPTER FIVE
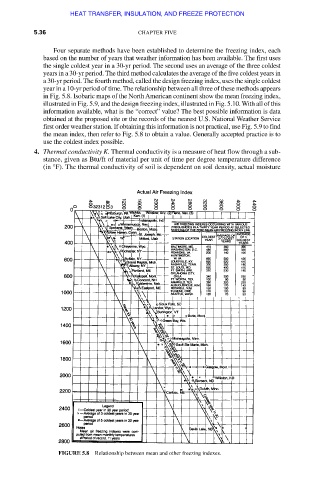
Four separate methods have been established to determine the freezing index, each
based on the number of years that weather information has been available. The first uses
the single coldest year in a 30-yr period. The second uses an average of the three coldest
years in a 30-yr period. The third method calculates the average of the five coldest years in
a 30-yr period. The fourth method, called the design freezing index, uses the single coldest
year in a 10-yr period of time. The relationship between all three of these methods appears
in Fig. 5.8. Isobaric maps of the North American continent show the mean freezing index,
illustrated in Fig. 5.9, and the design freezing index, illustrated in Fig. 5.10. With all of this
information available, what is the “correct” value? The best possible information is data
obtained at the proposed site or the records of the nearest U.S. National Weather Service
first order weather station. If obtaining this information is not practical, use Fig. 5.9 to find
the mean index, then refer to Fig. 5.8 to obtain a value. Generally accepted practice is to
use the coldest index possible.
4. Thermal conductivity K. Thermal conductivity is a measure of heat flow through a sub-
stance, given as Btu/ft of material per unit of time per degree temperature difference
(in °F). The thermal conductivity of soil is dependent on soil density, actual moisture
FIGURE 5.8 Relationship between mean and other freezing indexes.
Downloaded from Digital Engineering Library @ McGraw-Hill (www.accessengineeringlibrary.com)
Copyright © 2009 The McGraw-Hill Companies. All rights reserved.
Any use is subject to the Terms of Use as given at the website.