
Page 318 - Facility Piping Systems Handbook for Industrial, Commercial, and Healthcare Facilities
P. 318
SITE UTILITY SYSTEMS
6.40 CHAPTER SIX
TABLE 6.5 Reduction of Runoff Depth
Curve number (CN) *
Rainfall,
in 60 65 70 75 80 85 90 95 98
1.0 0 0 0 0.03 0.08 0.17 0.32 0.56 0.79
1.2 0 0 0.03 0.07 0.15 0.28 0.46 0.74 0.99
1.4 0 0.02 0.06 0.13 0.24 0.39 0.61 0.92 1.18
1.6 0.01 0.05 0.11 0.20 0.34 0.52 0.76 1.11 1.38
1.8 0.03 0.09 0.17 0.29 0.44 0.65 0.93 1.29 1.58
2.0 0.06 0.14 0.24 0.38 0.56 0.80 1.09 1.48 1.77
2.5 0.17 0.30 0.46 0.65 0.89 1.18 1.53 1.96 2.27
3.0 0.33 0.51 0.72 0.96 1.25 1.59 1.98 2.45 2.78
4.0 0.76 1.03 1.33 1.67 2.04 2.46 2.92 3.43 3.77
5.0 1.30 1.65 2.04 2.45 2.89 3.37 3.88 4.42 4.76
6.0 1.92 2.35 2.80 3.28 3.78 4.31 4.85 5.41 5.76
7.0 2.60 3.10 3.62 4.15 4.69 5.26 5.82 6.41 6.76
8.0 3.33 3.90 4.47 5.04 5.62 6.22 6.81 7.40 7.76
9.0 4.10 4.72 5.34 5.95 6.57 7.19 7.79 8.40 8.76
10.0 4.90 5.57 6.23 6.88 7.52 8.16 8.78 9.40 9.76
11.0 5.72 6.44 7.13 7.82 8.48 9.14 9.77 10.39 10.76
12.0 6.56 7.32 8.05 8.76 9.45 10.12 10.76 11.39 11.76
* To obtain runoff depths for CNs and other rainfall amounts not shown in this table, use an arithmetic interpolation.
† 1 in = 24.5 mm.
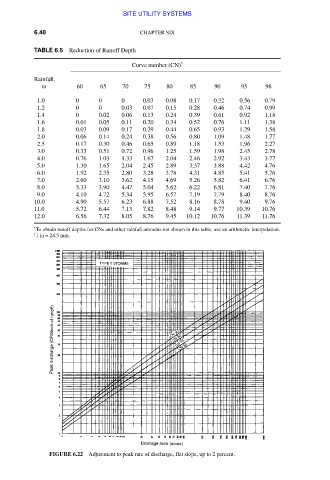
FIGURE 6.22 Adjustment to peak rate of discharge, flat slope, up to 2 percent.
Downloaded from Digital Engineering Library @ McGraw-Hill (www.accessengineeringlibrary.com)
Copyright © 2009 The McGraw-Hill Companies. All rights reserved.
Any use is subject to the Terms of Use as given at the website.