
Page 320 - Facility Piping Systems Handbook for Industrial, Commercial, and Healthcare Facilities
P. 320
SITE UTILITY SYSTEMS
6.42 CHAPTER SIX
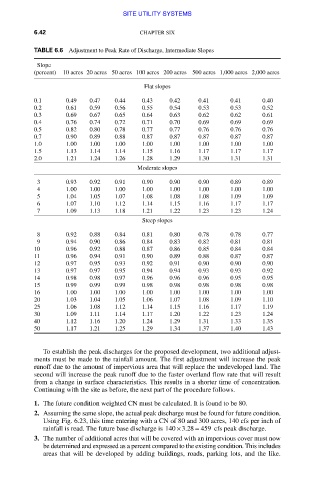
TABLE 6.6 Adjustment to Peak Rate of Discharge, Intermediate Slopes
Slope
(percent) 10 acres 20 acres 50 acres 100 acres 200 acres 500 acres 1,000 acres 2,000 acres
Flat slopes
0.1 0.49 0.47 0.44 0.43 0.42 0.41 0.41 0.40
0.2 0.61 0.59 0.56 0.55 0.54 0.53 0.53 0.52
0.3 0.69 0.67 0.65 0.64 0.63 0.62 0.62 0.61
0.4 0.76 0.74 0.72 0.71 0.70 0.69 0.69 0.69
0.5 0.82 0.80 0.78 0.77 0.77 0.76 0.76 0.76
0.7 0.90 0.89 0.88 0.87 0.87 0.87 0.87 0.87
1.0 1.00 1.00 1.00 1.00 1.00 1.00 1.00 1.00
1.5 1.13 1.14 1.14 1.15 1.16 1.17 1.17 1.17
2.0 1.21 1.24 1.26 1.28 1.29 1.30 1.31 1.31
Moderate slopes
3 0.93 0.92 0.91 0.90 0.90 0.90 0.89 0.89
4 1.00 1.00 1.00 1.00 1.00 1.00 1.00 1.00
5 1.04 1.05 1.07 1.08 1.08 1.08 1.09 1.09
6 1.07 1.10 1.12 1.14 1.15 1.16 1.17 1.17
7 1.09 1.13 1.18 1.21 1.22 1.23 1.23 1.24
Steep slopes
8 0.92 0.88 0.84 0.81 0.80 0.78 0.78 0.77
9 0.94 0.90 0.86 0.84 0.83 0.82 0.81 0.81
10 0.96 0.92 0.88 0.87 0.86 0.85 0.84 0.84
11 0.96 0.94 0.91 0.90 0.89 0.88 0.87 0.87
12 0.97 0.95 0.93 0.92 0.91 0.90 0.90 0.90
13 0.97 0.97 0.95 0.94 0.94 0.93 0.93 0.92
14 0.98 0.98 0.97 0.96 0.96 0.96 0.95 0.95
15 0.99 0.99 0.99 0.98 0.98 0.98 0.98 0.98
16 1.00 1.00 1.00 1.00 1.00 1.00 1.00 1.00
20 1.03 1.04 1.05 1.06 1.07 1.08 1.09 1.10
25 1.06 1.08 1.12 1.14 1.15 1.16 1.17 1.19
30 1.09 1.11 1.14 1.17 1.20 1.22 1.23 1.24
40 1.12 1.16 1.20 1.24 1.29 1.31 1.33 1.35
50 1.17 1.21 1.25 1.29 1.34 1.37 1.40 1.43
To establish the peak discharges for the proposed development, two additional adjust-
ments must be made to the rainfall amount. The first adjustment will increase the peak
runoff due to the amount of impervious area that will replace the undeveloped land. The
second will increase the peak runoff due to the faster overland flow rate that will result
from a change in surface characteristics. This results in a shorter time of concentration.
Continuing with the site as before, the next part of the procedure follows.
1. The future condition weighted CN must be calculated. It is found to be 80.
2. Assuming the same slope, the actual peak discharge must be found for future condition.
Using Fig. 6.23, this time entering with a CN of 80 and 300 acres, 140 cfs per inch of
rainfall is read. The future base discharge is 140 3 28× . = 459 cfs peak discharge.
3. The number of additional acres that will be covered with an impervious cover must now
be determined and expressed as a percent compared to the existing condition. This includes
areas that will be developed by adding buildings, roads, parking lots, and the like.
Downloaded from Digital Engineering Library @ McGraw-Hill (www.accessengineeringlibrary.com)
Copyright © 2009 The McGraw-Hill Companies. All rights reserved.
Any use is subject to the Terms of Use as given at the website.