
Page 152 - Failure Analysis Case Studies II
P. 152
137
of evidence pointed to the brittle fracture initiation occurring as the vessel encountered head seas
near the ice edge subsequent to the manoeuvring in the ice field, the failure initiation in the port
bilge keel having been triggered by wave impact on the bow.
As described in the paper by Corlett et al. [3], the period spent in the ice almost certainly led to
the general cooling down of the longitudinals and the shell beneath the water-line, as the bunker oil
solidified on the inner surface of the vessel in the calm conditions in the ice field. Without this
general lowering of the temperature of the ship plate to its NDT (nil ductility temperature) value,
the primary initiation induced in the port bilge keel would not have propagated with such disastrous
consequences. As noted in the failure investigation [l], there was evidence of other bilge keel details
which had cracked at some earlier occasion, but had not propagated into the ship’s structure.
The fracture mechanics calculations performed in the failure investigation and referred to by the
report of the court [2] were performed using the BSI PD6493 1980 procedures with an adjustment
to remove the inherent factors of safety in the analysis to facilitate critical predictions as described
in [4]. Subsequently, this analysis method was updated in 1991, and the Kurdistan casualty was re-
examined as part of the validation exercise along with many large-scale laboratory tests and other
well-documented failures [5].
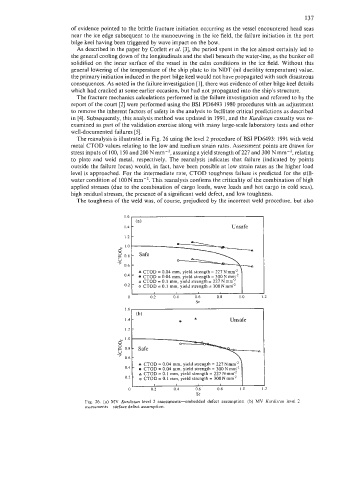
The reanalysis is illustrated in Fig. 26 using the level 2 procedure of BSI PD6493: 1991 with weld
metal CTOD values relating to the low and medium strain rates. Assessment points are drawn for
stress inputs of 100, 150 and 200 Nmm-*, assuming a yield strength of 227 and 300 Nmm-2, relating
to plate and weld metal, respectively. The reanalysis indicates that failure (indicated by points
outside the failure locus) would, in fact, have been possible at low strain rates as the higher load
level is approached. For the intermediate rate, CTOD toughness failure is predicted for the still-
water condition of 100 N mm-2. This reanalysis confirms the criticality of the combination of high
applied stresses (due to the combination of cargo loads, wave loads and hot cargo in cold seas),
high residual stresses, the presence of a significant weld defect, and low toughness.
The toughness of the weld was, of course, prejudiced by the incorrect weld procedure, but also
(a)
1.4 - Unsafe
-
1.2
& 1.0
0.8 - Safe
V
-7 0.6 -
- A CTOD = 0.04 mm, yield strength = 227 N mm-2 1
0 CTOD = 0.04 mm, yield strength = 300 N mrK2
- A CTOD = 0.1 mm, yield strength = 227 N mm-*
0.2 o CTOD = 0.1 mm, yield strength = 300 N mmS2
1 a I
I
0 0.2 0.4 0.6 0.8 I .a I .2
Sr
- (b)
1.4 A Unsafe
0
0 0.2 0.4 0.6 0.8 I .o 2
Sr
Fig. 26. (a) MV Kurdistan level 2 assessments-mbedded defect assumption. (b) MV Kurdislan level 2
assessments surface defect assumption.