
Page 28 - Failure Analysis Case Studies II
P. 28
15
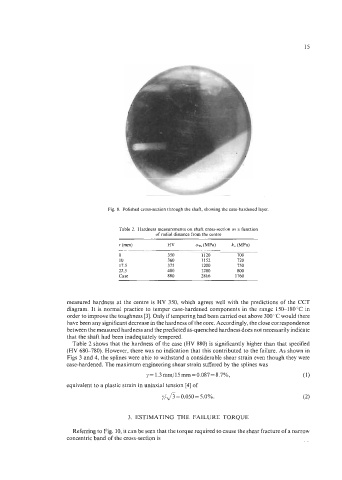
Fig. 8. Polished cross-section through the shaft, showing the case-hardened layer
Table 2. Hardness measurements on shaft cross-section as a function
of radial distance from the centre
r (mm) HV ~TS (MW k, (MPa)
0 350 1120 700
10 360 1152 720
17.5 375 1200 750
22.5 400 1280 800
Case 880 2816 1760
measured hardness at the centre is HV 350, which agrees well with the predictions of the CCT
diagram. It is normal practice to temper case-hardened components in the range 15G18O"C in
order to improve the toughness [3]. Only if tempering had been carried out above 300 "C would there
have been any significant decrease in the hardness of the core. Accordingly, the close correspondence
between the measured hardness and the predicted as-quenched hardness does not necessarily indicate
that the shaft had been inadequately tempered.
Table 2 shows that the hardness of the case (HV 880) is significantly higher than that specified
(HV 68G780). However, there was no indication that this contributed to the failure. As shown in
Figs 3 and 4, the splines were able to withstand a considerable shear strain even though they were
case-hardened. The maximum engineering shear strain suffered by the splines was
y = 1.3 mm/l5 mm = 0.087 = 8.7%, (1)
equivalent to a plastic strain in uniaxial tension [4] of
3. ESTIMATING THE FAILURE TORQUE
Referring to Fig. 10, it can be seen that the torque required to cause the shear fracture of a narrow
concentric band of the cross-section is