
Page 403 - Failure Analysis Case Studies II
P. 403
387
ranging from 10% to 40%. Then JIS 14 flat test pieces (JIS 22201) with a parallel portion of 35
mm were prepared and used in the tests.
The test pieces were precharged with hydrogen by immersing the test pieces, together with zinc
(2 : 1 surface area ratio), in a 15% HCI aqueous solution for 24 h at 40T, thereby forming a galvanic
coupling between the test piece and the zinc. As a result of this procedure, the charged hydrogen
content of the steel of the 30% reduction ratio test piece was 2.3 ppm, which is virtual2y the same
as that of the bent portion of the actual equipment. The test pieces were subjected to tensile tests at
ambient temperature at constant cross-head speed (a strain rate of 4.8 x sec-', which is a
sufficiently low speed to evaluate hydrogen embrittlement [ 11) immediately after being hydrogen-
charged and the surfaces and fractures of the test pieces were then examined.
4. EXPERIMENTAL RESULTS AND DISCUSSIONS
4.1. Strain at bent portion
Strain ci on the inner side of a panel which has been subjected to bending was approximated by
applying the following formula [3]:
where R = inner radius of bent portion, t = plate thickness and AI = distance from inner surface to
neutral axis.
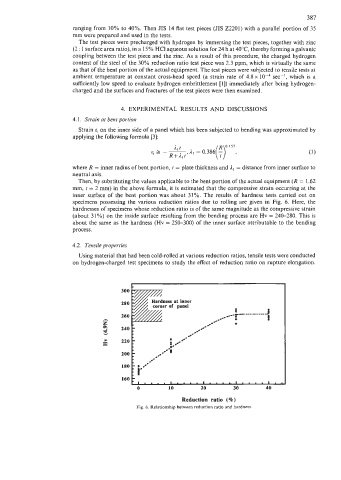
Then, by substituting the values applicable to the bent portion of the actual equipment (R = 1.62
mm, t = 2 mm) in the above formula, it is estimated that the compressive strain occumng at the
inner surface of the bent portion was about 31%. The results of hardness tests carried out on
specimens possessing the various reduction ratios due to rolling are given in Fig. 6. Here, the
hardnesses of specimens whose reduction ratio is of the same magnitude as the compressive strain
(about 31%) on the inside surface resulting from the bending process are Hv = 24&280. This is
about the same as the hardness (Hv = 250-300) of the inner surface attributable to the bending
process.
4.2. Tensile properties
Using material that had been cold-rolled at various reduction ratios, tensile tests were conducted
on hydrogen-charged test specimens to study the effect of reduction ratio on rupture elongation.
Hardness at inner
comer of panel
8 3
260 ,--r-"" ---I
t
240 - L --- .--
/-#
0.-
/*
220 1/ E.
.*'
I
200 c; .-• ,--
.e*
160 .
1 . . . . 1 . . . . 1 . . . . 1 . 4
0 10 20 30 40
Reduction ratio (%)
Fig. 6. Relationship between reduction ratio and hardness