
Page 447 - Failure Analysis Case Studies II
P. 447
430
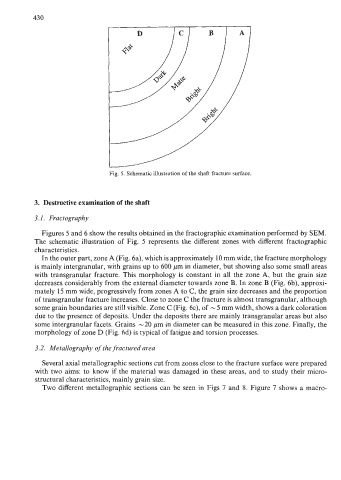
Fig. 5. Schematic illustration of the shaft fracture surface.
3. Destructive examination of the shaft
3.1. Fractography
Figures 5 and 6 show the results obtained in the fractographic examination performed by SEM.
The schematic illustration of Fig. 5 represents the different zones with different fractographic
characteristics.
In the outer part, zone A (Fig. 6a), which is approximately 10 mm wide, the fracture morphology
is mainly intergranular, with grains up to 600 pm in diameter, but showing also some small areas
with transgranular fracture. This morphology is constant in all the zone A, but the grain size
decreases considerably from the external diameter towards zone B. In zone B (Fig. 6b), approxi-
mately 15 mm wide, progressively from zones A to C, the grain size decreases and the proportion
of transgranular fracture increases. Close to zone C the fracture is almost transgranular, although
some grain boundaries are still visible. Zone C (Fig. 6c), of - 5 mm width, shows a dark coloration
due to the presence of deposits. Under the deposits there are mainly transgranular areas but also
some intergranular facets. Grains -20 pm in diameter can be measured in this zone. Finally, the
morphology of zone D (Fig. 6d) is typical of fatigue and torsion processes.
3.2. Metallography of the fractured area
Several axial metallographic sections cut from zones close to the fracture surface were prepared
with two aims: to know if the material was damaged in these areas, and to study their micro-
structural characteristics, mainly grain size.
Two different metallographic sections can be seen in Figs 7 and 8. Figure 7 shows a macro-