
Page 54 - Failure Analysis Case Studies II
P. 54
39
clay impregnated -pvel base layer
Fig. 6 . Schematic of visual observations in test excavation: (a) cross-section, (b) longitudinal section.
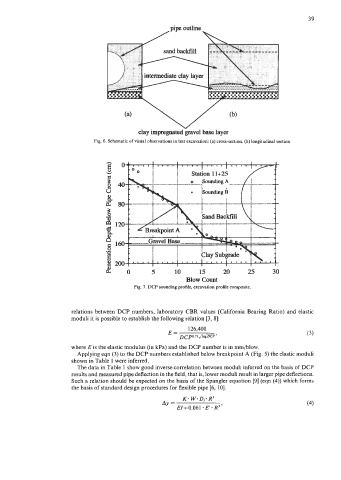
5 10 15 20 25 30
Blow Count
Fig. 7. DCP sounding profile, excavation profile composite.
relations between DCP numbers, laboratory CBR values (California Bearing Ratio) and elastic
moduli it is possible to establish the following relation [3, 81:
126,400
E= DCpO.7l~ (3)
’
where E is the elastic modulus (in kPa) and the DCP number is in mm/blow.
Applying eqn (3) to the DCP numbers established below breakpoint A (Fig. 5) the elastic moduli
shown in Table 1 were inferred.
The data in Table 1 show good inverse correlation between moduli inferred on the basis of DCP
results and measured pipe deflection in the field, that is, lower moduli result in larger pipe deflections.
Such a relation should be expected on the basis of the Spangler equation [9] (eqn (4)) which forms
the basis of standard design procedures for flexible pipe [6, lo].
D,.
K* W- R’
Ay = (4)
EIf0.061 -E’-R’’