
Page 56 - Failure Analysis Case Studies II
P. 56
41
the corrosive effect of the sewage. The insert would in effect functionally replace the damaged
internal concrete liner.
Design of engineering structures is frequently based on the notion of safety factors with respect
to strength. In the case of a pipe section it is reasonable to define a safety factor as:
where FSMom is a safety factor with respect to moments, Mu,, is the yield moment of the pipe cross
section, as determined on the basis of the laboratory testing and, M,, is the maximum moment
existing in a pipe section as loaded in the field. Essentially the basic engineering question to be
answered is whether the pipe in its existing deformed state, has a sufficiently high safety factor
allowing it to be utilized as structural element protecting the flexible insert.
In general the load distribution acting on a pipe section in the field is unknown, therefore, there
is no straightforward approach to estimate the moments (Mmax). To overcome this difficulty it was
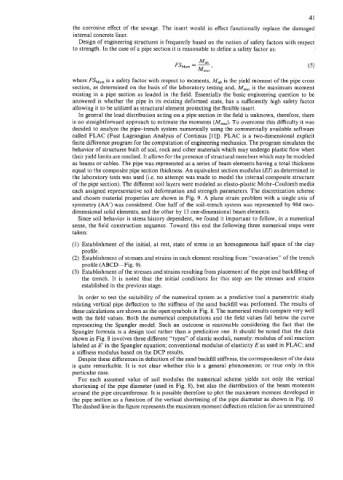
decided to analyze the pipetrench system numerically using the commercially available software
called FLAC (Fast Lagrangian Analysis of Continua [I 11). FLAC is a two-dimensional explicit
finite difference program for the computation of engineering mechanics. The program simulates the
behavior of structures built of soil, rock and other materials which may undergo plastic flow when
their yield limits are reached. It allows for the presence of structural members which may be modeled
as beams or cables. The pipe was represented as a series of beam elements having a total thickness
equal to the composite pipe section thickness. An equivalent section modulus (EI) as determined in
the laboratory tests was used (Le. no attempt was made to model the internal composite structure
of the pipe section). The different soil layers were modeled as elasto-plastic Mohr-Coulomb media
each assigned representative soil deformation and strength parameters. The discretization scheme
and chosen material properties are shown in Fig. 9. A plane strain problem with a single axis of
symmetry (AA) was considered. One half of the soil-trench system was represented by 984 two-
dimensional solid elements, and the other by 13 one-dimensional beam elements.
Since soil behavior is stress history dependent, we found it important to follow, in a numerical
sense, the field construction sequence. Toward this end the following three numerical steps were
taken:
(I) Establishment of the initial, at rest, state of stress in an homogeneous half space of the clay
profile.
(2) Establishment of stresses and strains in each element resulting from “excavation” of the trench
profile (ABCD-Fig. 9).
(3) Establishment of the stresses and strains resulting from placement of the pipe and backfilling of
the trench. It is noted that the initial conditions for this step are the stresses and strains
established in the previous stage.
in order to test the suitability of the numerical system as a predictive tool a parametric study
relating vertical pipe deflection to the stiffness of the sand backfill was performed. The results of
these calculations are shown as the open symbols in Fig. 8. The numerical results compare very well
with the field values. Both the numerical computations and the field values fall below the curve
representing the Spangler model. Such an outcome is reasonable considering the fact that the
Spangler formula is a design tool rather than a predicitive one. It should be noted that the data
shown in Fig. 8 involves three different “types” of elastic moduli, namely: modulus of soil reaction
labeled as E’ in the Spangler equation; conventional modulus of elasticity E as used in FLAC; and
a stiffness modulus based on the DCP results.
Despite these differences in definition of the sand backfill stiffness, the correspondence of the data
is quite remarkable. It is not clear whether this is a general phenomenon; or true only in this
particular case.
For each assumed value of soil modulus the numerical scheme yields not only the vertical
shortening of the pipe diameter (used in Fig. 8), but also the distribution of the beam moments
around the pipe circumference. It is possible therefore to plot the maximum moment developed in
the pipe section as a function of the vertical shortening of the pipe diameter as shown in Fig. 10.
The dashed line in the figure represents the maximum moment deflection relation for an unrestrained