
Page 55 - Failure Analysis Case Studies II
P. 55
40
Table 1. Field measured pipe deflection, DCP, moduli values
Depth DCP no. Elastic modulus Pipe deflection
Station no. (cm) (mm/blow) E (kPa) 6 (a)
~~
9 40-140 165 575 6.9
10+30 90-130 62 2500 3.8
11+27 75-150 35 5500 1.4
11+25 85-145 135 785 3.9
12 95-140 46 3800 2.5
12+50 65 50 3400 3.0
where Ay = pipe deflection (m), W = soil cover loads, taken as average prism load (kN/m), K = bed-
ding constant (non-dimensional), 0, = deflection lag factor (non-dimensional), R = pipe radius (m),
EZ = pipe stiffness factor (kN m), E' = soil reaction modulus (kPa).
Equation (4) was utilized with W = 80 kN/m (corresponding to a depth of 4-5 m of soil cover)
and a bedding constant K of 0.11. The choice of the bedding constant was based on the visual
examination and it corresponds to poor bedding conditions below the pipe invert. The deflection
lag factor D,, which accounts for pipe creep and dynamic loading, was taken as unity. The pipe
stiffness factor, EZ, was taken to be 13.5 kN m based on the results from laboratory tests.
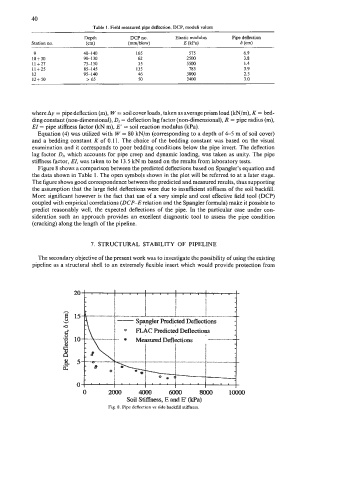
Figure 8 shows a comparison between the predicted deflections based on Spangler's equation and
the data shown in Table 1. The open symbols shown in the plot will be referred to at a later stage.
The figure shows good correspondence between the predicted and measured results, thus supporting
the assumption that the large field deflections were due to insufficient stiffness of the soil backfill.
More significant however is the fact that use of a very simple and cost effective field tool (DCP)
coupled with empirical correlations (DCP-E relation and the Spangler formula) make it possible to
predict reasonably well, the expected deflections of the pipe. In the particular case under con-
sideration such an approach provides an excellent diagnostic tool to assess the pipe condition
(cracking) along the length of the pipeline.
7. STRUCTURAL STABILITY OF PIPELINE
The secondary objective of the present work was to investigate the possibility of using the existing
pipeline as a structural shell to an extremely flexible insert which would provide protection from
t 1 I
I " ' ! " ' ! ' "
.---...-
.......... I ....._._......_. i.".."..."." .._." ............... i -
z.........
Spangler Predicted Deflections
0 FLAC predicted Deflections
i...i.. . i n ..1
I I
0 2000 4Ooo 6Ooo 8Ooo loo00
Soil Stiffness, E and E' Orpa)
Fig. 8. Pipe deflection vs side backfill stiffness.