
Page 271 - Fair, Geyer, and Okun's Water and wastewater engineering : water supply and wastewater removal
P. 271
JWCL344_ch07_230-264.qxd 8/2/10 8:44 PM Page 231
7.2 Water Demand Patterns 231
5. Operational studies
6. Rehabilitation studies
7. Vulnerability studies
8. Water quality studies.
The WaterGEMS program, in addition to other useful software, is available free to users of
this book. Educational versions of the software can be accessed online or from the CD that
accompanies this textbook.
7.2 WATER DEMAND PATTERNS
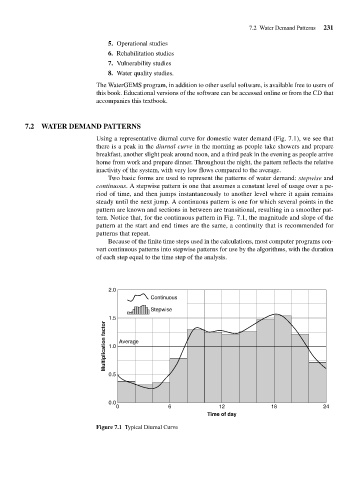
Using a representative diurnal curve for domestic water demand (Fig. 7.1), we see that
there is a peak in the diurnal curve in the morning as people take showers and prepare
breakfast, another slight peak around noon, and a third peak in the evening as people arrive
home from work and prepare dinner. Throughout the night, the pattern reflects the relative
inactivity of the system, with very low flows compared to the average.
Two basic forms are used to represent the patterns of water demand: stepwise and
continuous. A stepwise pattern is one that assumes a constant level of usage over a pe-
riod of time, and then jumps instantaneously to another level where it again remains
steady until the next jump. A continuous pattern is one for which several points in the
pattern are known and sections in between are transitional, resulting in a smoother pat-
tern. Notice that, for the continuous pattern in Fig. 7.1, the magnitude and slope of the
pattern at the start and end times are the same, a continuity that is recommended for
patterns that repeat.
Because of the finite time steps used in the calculations, most computer programs con-
vert continuous patterns into stepwise patterns for use by the algorithms, with the duration
of each step equal to the time step of the analysis.
2.0
Continuous
Stepwise
1.5
Multiplication factor 1.0 Average
0.5
0.0
0 6 12 18 24
Time of day
Figure 7.1 Typical Diurnal Curve