
Page 158 - Fiber Bragg Gratings
P. 158
4.2 Coupled-mode theory 135
In order to understand the various phase-matching conditions, we
shall begin with the dispersion diagram of modes. The propagation con-
stants of modes and their dispersion is crucial to the understanding of
phase matching. To facilitate an insight into the properties of modes, we
use the approximate analogy between rays and modes, since the visual
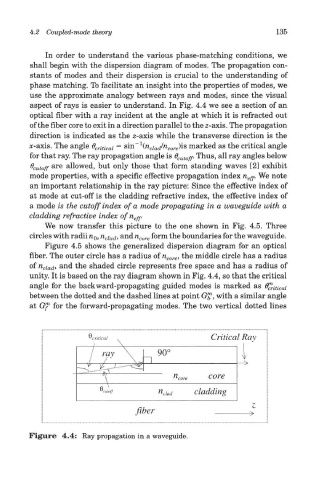
aspect of rays is easier to understand. In Fig. 4.4 we see a section of an
optical fiber with a ray incident at the angle at which it is refracted out
of the fiber core to exit in a direction parallel to the z-axis. The propagation
direction is indicated as the z-axis while the transverse direction is the
x-axis. The angle B criti cai = s Ii l n n s
^ ~ ( dad^ core^ marked as the critical angle
for that ray. The ray propagation angle is Q cutoff- Thus, all ray angles below
O cutoff are allowed, but only those that form standing waves [2] exhibit
mode properties, with a specific effective propagation index n eff. We note
an important relationship in the ray picture: Since the effective index of
at mode at cut-off is the cladding refractive index, the effective index of
a mode is the cutoff index of a mode propagating in a waveguide with a
cladding refractive index of n eff.
We now transfer this picture to the one shown in Fig. 4.5. Three
circles with radii n 0, n clad, and n core form the boundaries for the waveguide.
Figure 4.5 shows the generalized dispersion diagram for an optical
fiber. The outer circle has a radius of n core, the middle circle has a radius
of n ciad, and the shaded circle represents free space and has a radius of
unity. It is based on the ray diagram shown in Fig. 4.4, so that the critical
angle for the backward-propagating guided modes is marked as ff^uicai
between the dotted and the dashed lines at point G™, with a similar angle
at Gf for the forward-propagating modes. The two vertical dotted lines
Figure 4.4: Ray propagation in a waveguide.