
Page 418 - Fiber Bragg Gratings
P. 418
8.8 Gain-flattening and clamping in fiber amplifiers 395
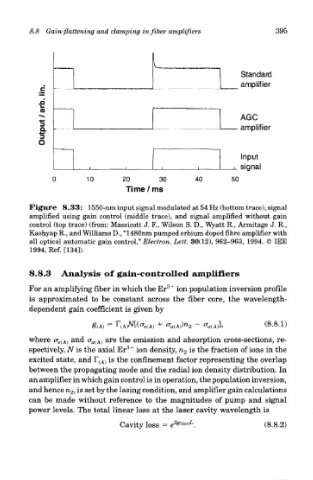
Figure 8.33: 1550-nm input signal modulated at 54 Hz (bottom trace), signal
amplified using gain control (middle trace), and signal amplified without gain
control (top trace) (from: Massicott J. F., Wilson S. D., Wyatt R., Armitage J. R.,
Kashyap R., and Williams D., "1480nm pumped erbium doped fibre amplifier with
all optical automatic gain control," Electron. Lett. 30(12), 962-963, 1994. © IEE
1994, Ref. [134]).
8.8.3 Analysis of gain-controlled amplifiers
3+
For an amplifying fiber in which the Er ion population inversion profile
is approximated to be constant across the fiber core, the wavelength-
dependent gain coefficient is given by
where o- e(A) and <r a(A) are the emission and absorption cross-sections, re-
3+
spectively, N is the axial Er ion density, n 2 is the fraction of ions in the
excited state, and F (A) is the confinement factor representing the overlap
between the propagating mode and the radial ion density distribution. In
an amplifier in which gain control is in operation, the population inversion,
and hence n 2, is set by the lasing condition, and amplifier gain calculations
can be made without reference to the magnitudes of pump and signal
power levels. The total linear loss at the laser cavity wavelength is