Page 420 - Fiber Bragg Gratings
P. 420
8.8 Gain-flattening and clamping in fiber amplifiers            397

         opposed to reflectors of lower reflectivity, offers greater resilience to stray
         light from other parts of the transmission system.


         8.8.5 Noise figure

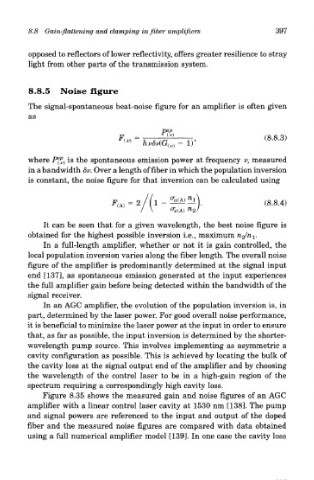
         The signal-spontaneous beat-noise figure for an amplifier is often given
         as


         where P^ is the spontaneous emission power at frequency v, measured
         in a bandwidth 8v. Over a length of fiber in which the population inversion
         is constant, the noise figure for that inversion can be calculated using


             It can be seen that for a given wavelength, the best noise figure is
         obtained for the highest possible inversion i.e., maximum n 2/rii.
             In a full-length amplifier, whether or not it is gain controlled, the
         local population inversion varies along the fiber length. The overall noise
        figure of the amplifier is predominantly determined at the signal input
         end [137], as spontaneous emission generated at the input experiences
        the full amplifier gain before being detected within the bandwidth of the
         signal receiver.
            In an AGC amplifier, the evolution of the population inversion is, in
        part, determined by the laser power. For good overall noise performance,
        it is beneficial to minimize the laser power at the input in order to ensure
        that, as far as possible, the input inversion is determined by the shorter-
        wavelength pump source. This involves implementing as asymmetric a
        cavity configuration as possible. This is achieved by locating the bulk of
        the cavity loss at the signal output end of the amplifier and by choosing
        the wavelength of the control laser to be in a high-gain region of the
        spectrum requiring a correspondingly high cavity loss.
            Figure 8.35 shows the measured gain and noise figures of an AGC
        amplifier with a linear control laser cavity at 1530 nm [138]. The pump
        and signal powers are referenced to the input and output of the doped
        fiber and the measured noise figures are compared with data obtained
        using a full numerical amplifier model [139]. In one case the cavity loss

