
Page 436 - Fiber Bragg Gratings
P. 436
9.1 Measurement of reflection and transmission spectra of Bragg gratings 413
where we remind ourselves that An is the ac index change and A is the
Bragg wavelength at the start of the growth of the grating.
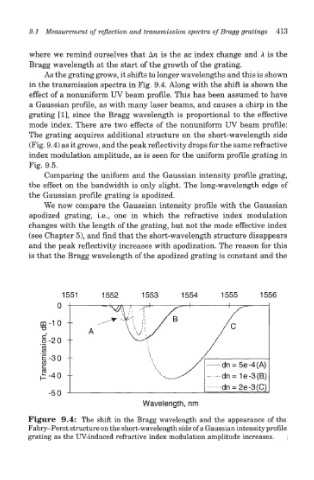
As the grating grows, it shifts to longer wavelengths and this is shown
in the transmission spectra in Fig. 9.4. Along with the shift is shown the
effect of a nonuniform UV beam profile. This has been assumed to have
a Gaussian profile, as with many laser beams, and causes a chirp in the
grating [1], since the Bragg wavelength is proportional to the effective
mode index. There are two effects of the nonuniform UV beam profile:
The grating acquires additional structure on the short-wavelength side
(Fig. 9.4) as it grows, and the peak reflectivity drops for the same refractive
index modulation amplitude, as is seen for the uniform profile grating in
Fig. 9.5.
Comparing the uniform and the Gaussian intensity profile grating,
the effect on the bandwidth is only slight. The long-wavelength edge of
the Gaussian profile grating is apodized.
We now compare the Gaussian intensity profile with the Gaussian
apodized grating, i.e., one in which the refractive index modulation
changes with the length of the grating, but not the mode effective index
(see Chapter 5), and find that the short-wavelength structure disappears
and the peak reflectivity increases with apodization. The reason for this
is that the Bragg wavelength of the apodized grating is constant and the
Figure 9.4: The shift in the Bragg wavelength and the appearance of the
Fabry-Perot structure on the short-wavelength side of a Gaussian intensity profile
grating as the UV-induced refractive index modulation amplitude increases.