
Page 438 - Fiber Bragg Gratings
P. 438
9.1 Measurement of reflection and transmission spectra of Bragg gratings 415
or from the peak of the reflected signal R p below the transmitted signal
it is (as shown in Fig. 9.2)
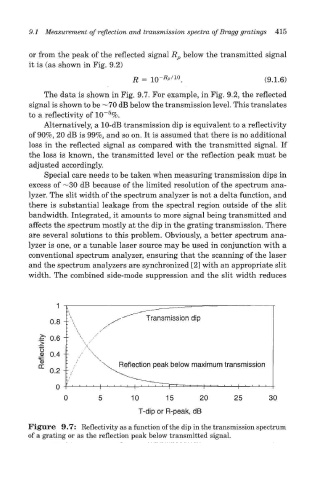
The data is shown in Fig. 9.7. For example, in Fig. 9.2, the reflected
signal is shown to be ~70 dB below the transmission level. This translates
5
to a reflectivity of 10~ %.
Alternatively, a 10-dB transmission dip is equivalent to a reflectivity
of 90%, 20 dB is 99%, and so on. It is assumed that there is no additional
loss in the reflected signal as compared with the transmitted signal. If
the loss is known, the transmitted level or the reflection peak must be
adjusted accordingly.
Special care needs to be taken when measuring transmission dips in
excess of —30 dB because of the limited resolution of the spectrum ana-
lyzer. The slit width of the spectrum analyzer is not a delta function, and
there is substantial leakage from the spectral region outside of the slit
bandwidth. Integrated, it amounts to more signal being transmitted and
affects the spectrum mostly at the dip in the grating transmission. There
are several solutions to this problem. Obviously, a better spectrum ana-
lyzer is one, or a tunable laser source may be used in conjunction with a
conventional spectrum analyzer, ensuring that the scanning of the laser
and the spectrum analyzers are synchronized [2] with an appropriate slit
width. The combined side-mode suppression and the slit width reduces
Figure 9.7: Reflectivity as a function of the dip in the transmission spectrum
of a grating or as the reflection peak below transmitted signal.