
Page 451 - Fiber Bragg Gratings
P. 451
428 Chapter 9 Measurement and Characterization of Gratings
where AA^w/fM is the source linewidth and A is the center wavelength,
and the resolution R = IJ^n where n g is the group index. For &AFWHM =
55 nm at A = 1300 nm, we get l c = 18.3 /mi and hence R = 9.1 /mi.
The grating spectra are recorded by scanning the reference mirror.
In a modified version of the setup, a rotating corner cube is used for
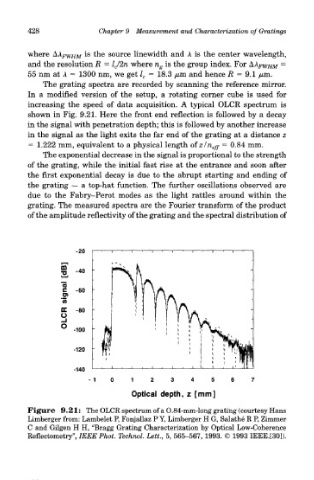
increasing the speed of data acquisition. A typical OLCR spectrum is
shown in Fig. 9.21. Here the front end reflection is followed by a decay
in the signal with penetration depth; this is followed by another increase
in the signal as the light exits the far end of the grating at a distance z
= 1.222 mm, equivalent to a physical length of z/n eff = 0.84 mm.
The exponential decrease in the signal is proportional to the strength
of the grating, while the initial fast rise at the entrance and soon after
the first exponential decay is due to the abrupt starting and ending of
the grating — a top-hat function. The further oscillations observed are
due to the Fabry-Perot modes as the light rattles around within the
grating. The measured spectra are the Fourier transform of the product
of the amplitude reflectivity of the grating and the spectral distribution of
Figure 9.21: The OLCR spectrum of a O.84-mm-long grating (courtesy Hans
Limberger from: Lambelet P, Fonjallaz P Y, Limberger H G, Salathe R P, Zimmer
C and Gilgen H H, "Bragg Grating Characterization by Optical Low-Coherence
Reflectometry", IEEE Phot. Technol. Lett., 5, 565-567, 1993. © 1993 IEEE.[30]).