
Page 455 - Fiber Bragg Gratings
P. 455
432 Chapter 9 Measurement and Characterization of Gratings
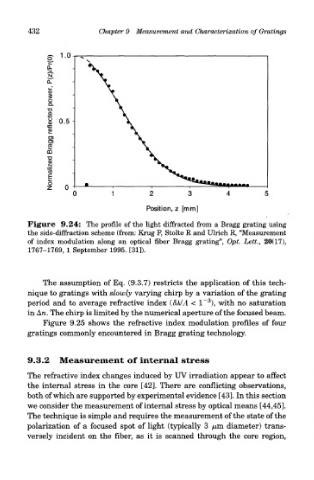
Figure 9.24: The profile of the light diffracted from a Bragg grating using
the side-diffraction scheme (from: Krug P, Stolte R and Ulrich R, "Measurement
of index modulation along an optical fiber Bragg grating", Opt. Lett., 20(17),
1767-1769, 1 September 1995. [31]).
The assumption of Eq. (9.3.7) restricts the application of this tech-
nique to gratings with slowly varying chirp by a variation of the grating
3
period and to average refractive index (8MA < 1~ ), with no saturation
in An. The chirp is limited by the numerical aperture of the focused beam.
Figure 9.25 shows the refractive index modulation profiles of four
gratings commonly encountered in Bragg grating technology.
9.3.2 Measurement of internal stress
The refractive index changes induced by UV irradiation appear to affect
the internal stress in the core [42]. There are conflicting observations,
both of which are supported by experimental evidence [43]. In this section
we consider the measurement of internal stress by optical means [44,45].
The technique is simple and requires the measurement of the state of the
polarization of a focused spot of light (typically 3 /urn diameter) trans-
versely incident on the fiber, as it is scanned through the core region,