Page 454 - Fiber Bragg Gratings
P. 454
9.3 Phase and temporal response of Bragg gratings                431

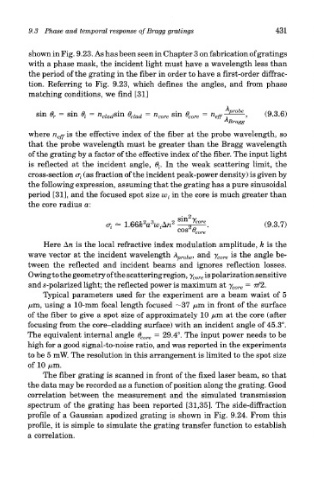
        shown in Fig. 9.23. As has been seen in Chapter 3 on fabrication of gratings
        with a phase mask, the incident light must have a wavelength less than
        the period of the grating in the fiber in order to have a first-order diffrac-
        tion. Referring to Fig. 9.23, which defines the angles, and from phase
        matching conditions, we find [31]


        where n eff is the effective index of the fiber at the probe wavelength, so
        that the probe wavelength must be greater than the Bragg wavelength
        of the grating by a factor of the effective index of the fiber. The input light
        is reflected at the incident angle, 6 t. In the weak scattering limit, the
        cross-section a- t (as fraction of the incident peak-power density) is given by
        the following expression, assuming that the grating has a pure sinusoidal
        period [31], and the focused spot size w t in the core is much greater than
        the core radius a:


            Here Arc is the local refractive index modulation amplitude, k is the
        wave vector at the incident wavelength A probe, and y core is the angle be-
        tween the reflected and incident beams and ignores reflection losses.
        Owing to the geometry of the scattering region, y core is polarization sensitive
        and s-polarized light; the reflected power is maximum at y core = 77/2.
            Typical parameters used for the experiment are a beam waist of 5
        /mm, using a 10-mm focal length focused ~37 /mi in front of the surface
        of the fiber to give a spot size of approximately 10 /um at the core (after
        focusing from the core-cladding surface) with an incident angle of 45.3°.
        The equivalent internal angle 6 core = 29.4°. The input power needs to be
        high for a good signal-to-noise ratio, and was reported in the experiments
        to be 5 mW. The resolution in this arrangement is limited to the spot size
        of 10 /tni.
            The fiber grating is scanned in front of the fixed laser beam, so that
        the data may be recorded as a function of position along the grating. Good
        correlation between the measurement and the simulated transmission
        spectrum of the grating has been reported [31,35]. The side-diffraction
        profile of a Gaussian apodized grating is shown in Fig. 9.24. From this
        profile, it is simple to simulate the grating transfer function to establish
        a correlation.

