
Page 208 - Fiber Fracture
P. 208
STRENGTH AND FRACTURE OF METALLIC FILAMENTS 193
200 Pole figures
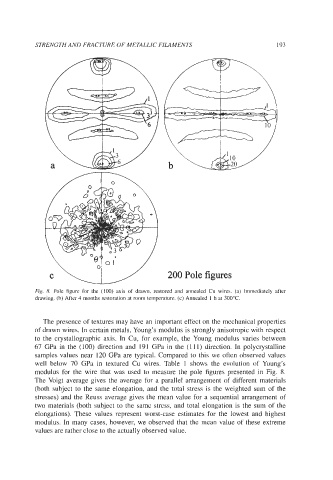
Fig. 8. Pole figure for the (100) axis of drawn, restored and annealed Cu wires. (a) Immediately after
drawing. (b) After 4 months restoration at room temperature. (c) Annealed 1 h at 300°C.
The presence of textures may have an important effect on the mechanical properties
of drawn wires. In certain metals, Young’s modulus is strongly anisotropic with respect
to the crystallographic axis. In Cu, for example, the Young modulus varies between
67 GPa in the (100) direction and 191 GPa in the (111) direction. In polycrystalline
samples values near 120 GPa are typical. Compared to this we often observed values
well below 70 GPa in textured Cu wires. Table 1 shows the evolution of Young’s
modulus for the wire that was used to measure the pole figures presented in Fig. 8.
The Voigt average gives the average for a parallel arrangement of different materials
(both subject to the same elongation, and the total stress is the weighted sum of the
stresses) and the Reus average gives the mean value for a sequential arrangement of
two materials (both subject to the same stress, and total elongation is the sum of the
elongations). These values represent worst-case estimates for the lowest and highest
modulus. In many cases, however, we observed that the mean value of these extreme
values are rather close to the actually observed value.