
Page 232 - Fiber Fracture
P. 232
STRENGTH AND FRACTURE OF METALLIC FILAMENTS 217
500
Cu wire 0 30 pm R = 0
-
7 400
E I I - \- I
300
w
v1
3
;
200
.C( ?i
x
5 100
0
1 1 o2 104 106 1 os
Number of cycles to rupture d
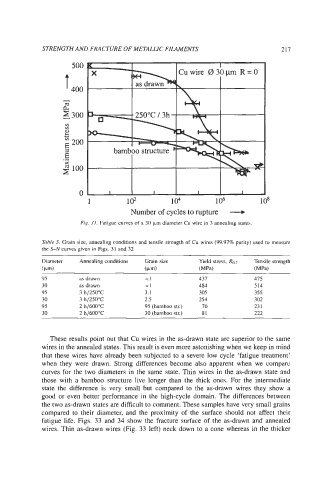
Fix. 31. Fatigue curves of a 30 pm diameter Cu wirc in 3 annealing states.
Table 5. Grain size, annealing conditions and tensile strength of Cu wires (99.97% punty) used to measure
the S-N curves given in Figs. 31 and 32
Diameter Annealing conditions Grain size Yield stress, R0.2 Tensile strength
(w) (elm) (MPa) (MPa)
95 as drawn <I 437 475
30 as drawn <I 484 514
9.5 3 h/2.50°C 3. I 305 3.55
30 3 h/2500C 2.5 254 302
95 2 h/600'C 95 (bamboo str.) 70 23 1
30 2 h/600"C 30 (bamboo str.) 81 222
These results point out that Cu wires in the as-drawn state are superior to the same
wires in the annealed states. This result is even more astonishing when we keep in mind
that these wires have already been subjected to a severe low cycle 'fatigue treatment'
when they were drawn. Strong differences become also apparent when we compare
curves for the two diameters in the same state. Thin wires in the as-drawn state and
those with a bamboo structure live longer than the thick ones. For the intermediate
state the difference is very small but compared to the as-drawn wires they show a
good or even better performance in the high-cycle domain. The differences between
the two as-drawn states are difficult to comment. These samples have very small grains
compared to their diameter, and the proximity of the surface should not affect their
fatigue life. Figs. 33 and 34 show the fracture surface of the as-drawn and annealed
wires. Thin as-drawn wires (Fig. 33 left) neck down to a cone whereas in the thicker