
Page 236 - Fiber Fracture
P. 236
STRENGTH AND FRACTURE OF METALLIC FILAMENTS 22 1
t 2oo
E
2 20
.e
x
5
0
Number of cycles to rupture +
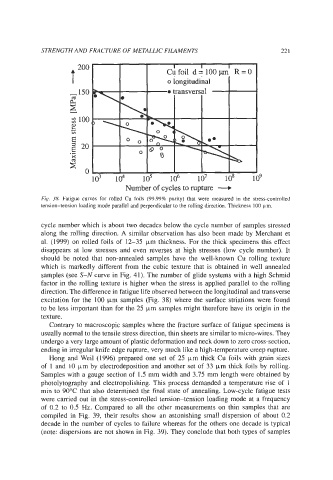
Fig. 38. Fatigue curves for rolled Cu foils (99.99% punty) that were measured in the stress-controlled
tension-tension loading mode parallel and perpendicular to the rolling direction. Thickness Io0 pm.
cycle number which is about two decadcs below the cycle number of samples stressed
along the rolling direction. A similar observation has also been made by Merchant et
al. (1999) on rolled foils of 12-35 pm thickness. For the thick specimens this effect
disappears at low stresses and even reverses at high stresses (low cycle number). It
should be noted that non-annealed samples have the well-known Cu rolling texture
which is markedly different from the cubic texture that is obtained in well annealed
samples (see S-N curve in Fig. 41). The number of glide systems with a high Schmid
factor in the rolling texture is higher when the stress is applied parallel to the rolling
direction. The difference in fatigue life observed between the longitudinal and transverse
excitation for the 100 pm samples (Fig. 38) where the surface striations were found
to be less important than for the 25 pm samples might therefore have its origin in the
texture.
Contrary to macroscopic samples where the fracture surface of fatigue specimens is
usually normal to the tensile stress direction, thin sheets are similar to micro-wires. They
undergo a very large amount of plastic deformation and neck down to zero cross-section,
ending in irregular knife edge rupture, very much like a high-temperature creep rupture.
Hong and Weil (1996) prepared one set of 25 pm thick Cu foils with grain sizes
of 1 and 10 pm by electrodeposition and another set of 33 pm thick foils by rolling.
Samples with a gauge section of 1.5 mm width and 3.75 mm length were obtained by
photolytography and electropolishing. This process demanded a temperature rise of 1
min to 90°C that also determined the final state of annealing. Low-cycle fatigue tests
were carried out in the stress-controlled tension-tension loading mode at a frequency
of 0.2 to 0.5 Hz. Compared to all the other measurements on thin samples that are
compiled in Fig. 39, their results show an astonishing small dispersion of about 0.2
decade in the number of cycles to failure whereas for the others one decade is typical
(note: dispersions are not shown in Fig. 39). They conclude that both types of samples