
Page 241 - Fiber Fracture
P. 241
STRENGTH AND FRACTURE OF METALLIC FILAMENTS 225
250
t
-
200
2
z
z
u 150
v1
5 100
50
1 loz io4 1 o6 lo8
Number of cycles to rupture
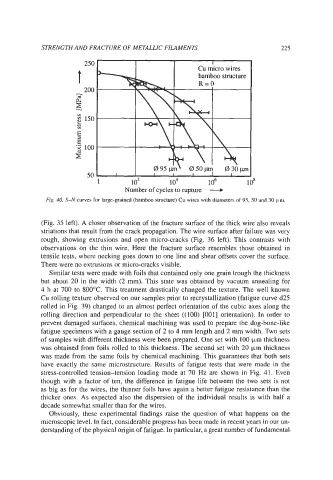
Fig. 40. S-N curves for large-grained (bamboo structure) Cu wires with diameters of 95, 50 and 30 Iim.
(Fig. 35 left). A closer observation of the fracture surface of the thick wire also reveals
striations that result from the crack propagation. The wire surface after failure was very
rough, showing extrusions and open micro-cracks (Fig. 36 left). This contrasts with
observations on the thin wire. Here the fracture surface resembles those obtained in
tensile tests, where necking goes down to one line and shear offsets cover the surface.
There were no extrusions or micro-cracks visible.
Similar tests were made with foils that contained only one grain trough the thickness
but about 20 in the width (2 mm). This state was obtained by vacuum annealing for
4 h at 700 to 800°C. This treatment drastically changed the texture. The well known
Cu rolling texture observed on our samples prior to recrystallization (fatigue curve d25
rolled in Fig. 39) changed to an almost perfect orientation of the cubic axes along the
rolling direction and perpendicular to the sheet ((100) [OOl] orientation). In order to
prevent damaged surfaces, chemical machining was used to prepare the dog-bone-like
fatigue specimens with a gauge section of 2 to 4 mm length and 2 mm width. Two sets
of samples with different thickness were been prepared. One set with 100 pm thickness
was obtained from foils rolled to this thickness. The second set with 20 pm thickness
was made from the same foils by chemical machining. This guarantees that both sets
have exactly the same microstructure. Results of fatigue tests that were made in the
stress-controlled tension-tension loading mode at 70 Hz are shown in Fig. 41. Even
though with a factor of ten, the difference in fatigue life between the two sets is not
as big as for the wires, the thinner foils have again a better fatigue resistance than the
thicker ones. As expected also the dispersion of the individual results is with half a
decade somewhat smaller than for the wires.
Obviously, these experimental findings raise the question of what happens on the
microscopic level. In fact, considerable progress has been made in recent years in our un-
derstanding of the physical origin of fatigue. In particular, a great number of fundamental