
Page 242 - Fiber Fracture
P. 242
226 H.U. Kunzi
tloo
n 75
E
3
W 50
v)
E
25
.A
x
E
Number of cycles to rupture -+
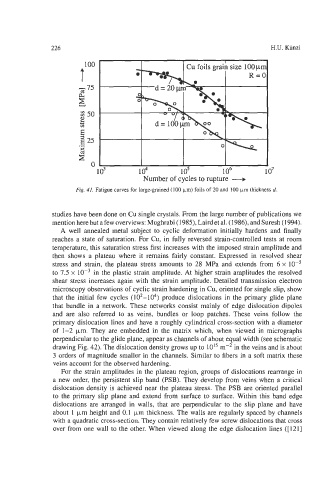
Fig. 41. Fatigue curves for large-grained (I00 pm) foils of 20 and 100 Fm thickness d.
studies have been done on Cu single crystals. From the large number of publications we
mention here but a few overviews: Mughrabi (1 985), Laird et al. (1 986), and Suresh (1 994).
A well annealed metal subject to cyclic deformation initially hardens and finally
reaches a state of saturation. For Cu, in fully reversed strain-controlled tests at room
temperature, this saturation stress first increases with the imposed strain amplitude and
then shows a plateau where it remains fairly constant. Expressed in resolved shear
stress and strain, the plateau stress amounts to 28 MPa and extends from 6x IOp5
to 7.5 x IOp3 in the plastic strain amplitude. At higher strain amplitudes the resolved
shear stress increases again with the strain amplitude. Detailed transmission electron
microscopy observations of cyclic strain hardening in Cu, oriented for single slip, show
that the initial few cycles (102-104) produce dislocations in the primary glide plane
that bundle in a network. These networks consist mainly of edge dislocation dipoles
and are also referred to as veins, bundles or loop patches. These veins follow the
primary dislocation lines and have a roughly cylindrical cross-section with a diameter
of 1-2 pm. They are embedded in the matrix which, when viewed in micrographs
perpendicular to the glide plane, appear as channels of about equal width (see schematic
drawing Fig. 42). The dislocation density grows up to IOl5 m-* in the veins and is about
3 orders of magnitude smaller in the channels. Similar to fibers in a soft matrix these
veins account for the observed hardening.
For the strain amplitudes in the plateau region, groups of dislocations rearrange in
a new order, the persistent slip band (PSB). They develop from veins when a critical
dislocation density is achieved near the plateau stress. The PSB are oriented parallel
to the primary slip plane and extend from surface to surface. Within this band edge
dislocations are arranged in walls, that are perpendicular to the slip plane and have
about I pm height and 0.1 pm thickness. The walls are regularly spaced by channels
with a quadratic cross-section. They contain relatively few screw dislocations that cross
over from one wall to the other. When viewed along the edge dislocation lines ([I211