
Page 237 - Fiber Fracture
P. 237
222 H.U. Kiinzi
1000
1 300
c
2 100
5
2
.e
X
30
10
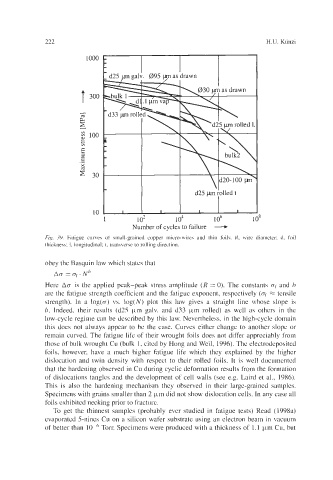
Fig. 39. Fatigue curves of small-grained copper micro-wires and thin foils. Lil, wire diameter; d, foil
thickness; 1, longitudinal; t, transverse to rolling direction.
obey the Basquin law which states that
N
An = af. h
Here Aa is the applied peak-peak stress amplitude (R = 0). The constants q and b
are the fatigue strength coefficient and the fatigue exponent, respectively (af x tensile
strength). In a log(a) vs. log(N) plot this law gives a straight line whose slope is
b. Indeed, their results (d25 km galv. and d33 wm rolled) as well as others in the
low-cycle regime can be described by this law. Nevertheless, in the high-cycle domain
this does not always appear to be the case. Curves either change to another slope or
remain curved. The fatigue life of their wrought foils does not differ appreciably from
those of bulk wrought Cu (bulk 1, cited by Hong and Weil, 1996). The electrodeposited
foils, however, have a much higher fatigue life which they explained by the higher
dislocation and twin density with respect to their rolled foils. It is well documented
that the hardening observed in Cu during cyclic deformation results from the formation
of dislocations tangles and the development of cell walls (see e.g. Laird et al., 1986).
This is also the hardening mechanism they observed in their large-grained samples.
Specimens with grains smaller than 2 km did not show dislocation cells. In any case all
foils exhibited necking prior to fracture.
To get the thinnest samples (probably ever studied in fatigue tests) Read (1998a)
evaporated 5-nines Cu on a silicon wafer substrate using an electron beam in vacuum
of better than lop6 Torr. Specimens were produced with a thickness of 1.1 km Cu, but