
Page 246 - Fiber Fracture
P. 246
230 H.U. Kiinzi
however, always somewhat smaller than in crystalline alloys of the same composition.
For the bulk modulus B, the difference remains relatively small, on the order of 4 to 6%,
and is explained by the lower density which increases by 1 to 2% on crystallization. For
the elastic and the shear modulus these differences amount to 25 and 35%, respectively.
Using the relations that exist between the elastic constants of isotropic bodies this gives
a Poisson ratio that is 3 to 7% larger than in the crystalline state. This elastic softening
is explained by small and fast local stress-induced displacement of atoms which result
from non-central interatomic forces (Weaire et al., 1971; Lanqon et al., 1985). This
means that not all atoms displace exactly as we would expect them to do from the
macroscopic strain field. Note that an isotropic solid bonded only by central forces
(sometimes referred to as a Cauchy solid) would have a single independent elastic
constant (B = ZG = $E) and Poisson’s ratio would have a material-independent value
of :. This does of course not hold in crystalline metals but the effect of non-central
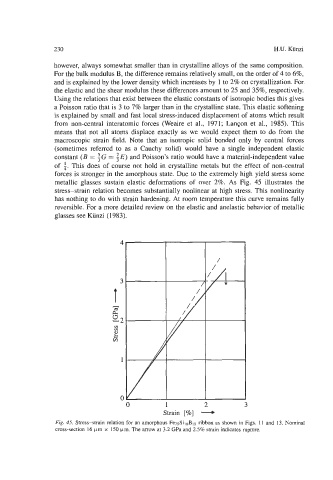
forces is stronger in the amorphous state. Due to the extremely high yield stress some
metallic glasses sustain elastic deformations of over 2%. As Fig. 45 illustrates the
stress-strain relation becomes substantially nonlinear at high stress. This nonlinearity
has nothing to do with strain hardening. At room temperature this curve remains fully
reversible. For a more detailed review on the elastic and anelastic behavior of metallic
glasses see Kiinzi (1983).
0 1 2 3
Strain [%] --e
Fig. 45. Stress-strain relation for an amorphous Fe7sSi,oBls ribbon as shown in Figs. 11 and 13. Nominal
cross-section 16 pm x 150 pm. The arrow at 3.2 GPa and 2.5% strain indicates rupture.