
Page 250 - Fiber Fracture
P. 250
234 H.U. Kiinzi
(Megusar et al., 1979). More recently, Flores and Dauskardt (1999) measured this
temperature rise by infrared imaging techniques in a Zr-Ti-Ni-Cu-Be bulk amorphous
alloy and observed a maximum temperature increase relative to ambient of 22.5"C at the
crack tip. This is somewhat smaller, but still of the same magnitude as the prediction of
about 55°C by their theoretical models. Alternatively, it was suggested (Spaepen, 1975,
1977; Steif et al., 1982) that the intense shearing and the negative hydrostatic pressure
produces a dilation of the structure (by production of free volume) which also would
decrease the viscosity in the shear bands. Pampillo (1975) and Davies (1978) point out
that after the appearance of a strong shear offset, giving rise to the smooth part of the
fracture surface, cracks nucleate at different weak spots and propagate. In fact there
are many examples where tributary veins, starting from a larger ring-shaped vein, point
to spots where cracks probably initiated (see right side of fracture surface Fig. 47a).
Veins are then formed by internal necking along lines where two crack fronts meet. The
observation of small slip bands along the length of veins in the STM by Kulawansa et
al. (1993) provides direct evidence for this deformation.
However, in order to explain the occurrence of veins that point towards a center the
crack has to assume rather quickly a star-like form with spikes that move outwards. In
fact Li (1978) proposed arguments that can explain the observed vein structures. In his
picture, slip in metallic glasses arises from the displacement of generalized dislocations
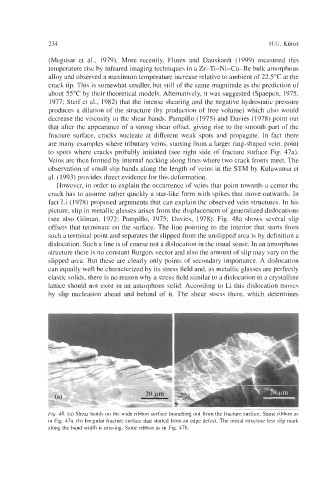
(see also Gilman, 1972; Pampillo, 1975; Davies, 1978). Fig. 48a shows several slip
offsets that terminate on the surface. The line pointing to the interior that starts from
such a terminal point and separates the slipped from the unslipped area is by definition a
dislocation. Such a line is of course not a dislocation in the usual sense. In an amorphous
structure there is no constant Burgers vector and also the amount of slip may vary on the
slipped area. But these are clearly only points of secondary importance. A dislocation
can equally well be characterized by its stress field and, as metallic glasses are perfectly
elastic solids, there is no reason why a stress field similar to a dislocation in a crystalline
lattice should not exist in an amorphous solid. According to Li this dislocation moves
by slip nucleation ahead and behind of it. The shear stress there, which determines
Fig. 48. (a) Shear bands on the wide ribbon surface branching out from the fracture surface. Same ribbon as
in Fig. 47a. (b) Irregular fracture surface that started from an edge defect. The initial structure less slip mark
along the band width is missing. Same ribbon as in Fig. 47b.