
Page 251 - Fiber Fracture
P. 251
STRENGTH AND FRACTURE OF METALLIC FILAMENTS 235
the nucleation rate and therefore the velocity, is the sum of the applied stress and
the internal stress from the dislocation. Comparing the total shear stress components
ahead of positively and negatively curved dislocations shows that this stress is smaller
when the dislocation bows out and larger when it bows in. Consequently, an oscillatory
dislocation line will straighten during their displacement. This explains the straight vein
that marks the end of the slipped region. The remaining part of the fracture surface
occurred in the tensile mode and its structure results from opening of cracks driven by
the negative hydrostatic pressure. Tensile crack propagation is faster in the presence of
vacancy like defects (free volume). Such defects are supposed to be numerous in the slip
band initially produccd. In addition to this, the hydrostatic stress gradient ahead of the
crack front can transfer free volume towards the crack front and thus further accelerate
its propagation. Since the stress gradient is larger for smaller positive curvature of the
crack front, the propagation of the front is unstable. Bowing out parts move faster
than inward-bowed ones. An alternative model to explain the vein structure has been
proposed by Spaepen (1975). He assumes that the viscosity in the shear band drops to
values that allow a liquid-like flow.
Fatigue of Metallic Glasses
Only EL limited amount of experimental work on fatigue of metallic glasses has been
reported in the literature and only few general conclusions can be drawn. Ogura et al.
(1 975), Davies (1976), Frommeyer and Seifert (198 1) and Chaki and Li (1 984) studied
thin ribbons made of Pd, Fe, Co and Ni based alloys in the tension-tension loading
mode. Doi et al. (1981) and Hagiwara et al. (1985) measured wires and ribbons in the
bending mode. Gilbert et al. (1998) studied fatigue and crack propagation in a bulk
amorphous alloy of the composition Zr4, .2Ti,3.gCu12.5Ni,oBe22.5. Bulk amorphous alloys
can only be produced with alloys having an extremely slow crystallization kinetics.
Only very few alloys of rather complex composition are known to have this property
and remain amorphous with cooling rates as low as 10 K s-I.
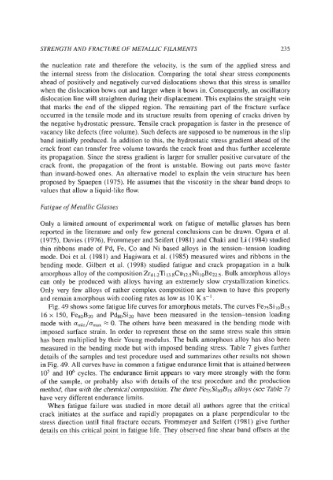
Fig. 49 shows some fatigue life curves for amorphous metals. The curves Fe-IsSiloB 1.5
16 x 150, FegoB2o and Pdg"Si20 have been measured in the tension-tension loading
mode with % 0. The others have been measured in the bending mode with
imposed surface strain. In order to represent these on the same stress scale this strain
has been multiplied by their Young modulus. The bulk amorphous alloy has also been
measured in the bending mode but with imposed bending stress. Table 7 gives further
details of the samples and test procedure used and summarizes other results not shown
in Fig. 49. All curves have in common a fatigue endurance limit that is attained between
lo5 and lo6 cycles. The endurance limit appears to vary more strongly with the form
of the sample, or probably also with details of the test procedure and the production
method, than with the chemical composition. The three Fe&3iloBl5 alloys (see Table 7)
have very different endurance limits.
When fatigue failure was studied in more detail all authors agree that the critical
crack initiates at the surface and rapidly propagates on a plane perpendicular to the
stress direction until final fracture occurs. Frommeyer and Seifert (I98 1) give further
details on this critical point in fatigue life. They observed fine shear band offsets at the