
Page 254 - Fiber Fracture
P. 254
STRENGTH AND FRACTURE OF METALLIC FILAMENTS 237
piano wire \
lo2 io4 1 o6 I B
Number of cycles to failure
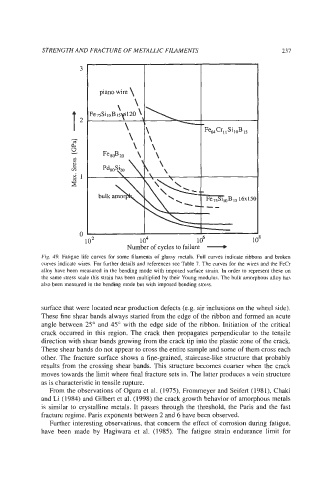
Fig. 49. Fatigue life curves for some filaments of glassy metals. Full curves indicate ribbons and broken
curves indicate wires. For further details and references see Table 7. The curves for the wires and the FeCr
alloy have been measured in the bending mode with imposed surface strain. In order to represent these on
the same stress scale this strain has been multiplied by their Young modulus. The bulk amorphous alloy has
also been measured in the bending mode but with imposed bending stress.
surface that were located near production defects (e.g. air inclusions on the wheel side).
These fine shear bands always started from the edge of the ribbon and formed an acute
angle between 25" and 45" with the edge side of the ribbon. Initiation of the critical
crack occurred in this region. The crack then propagates perpendicular to the tensile
direction with shear bands growing from the crack tip into the plastic zone of the crack.
These shear bands do not appear to cross the entire sample and some of them cross each
other. The fracture surface shows a fine-grained, staircase-like structure that probably
results from the crossing shear bands. This structure becomes coarser when the crack
moves towards the limit where final fracture sets in. The latter produces a vein structure
as is characteristic in tensile rupture.
From the observations of Ogura et al. (1975), Frommeyer and Seifert (1981), Chaki
and Li (1984) and Gilbert et al. (1998) the crack growth behavior of amorphous metals
is similar to crystalline metals. It passes through the threshold, the Paris and the fast
fracture regime. Paris exponents between 2 and 6 have been observed.
Further interesting observations, that concern the effect of corrosion during fatigue,
have been made by Hagiwara et al. (1985). The fatigue strain endurance limit for