
Page 313 - Fiber Fracture
P. 313
FRACTURE OF SYNTHETIC POLYMER FIBERS 295
15 I I I I
- 10
m
a
z
ffl
ffl
2?
5
5
0.04
0.02
0 I
1 10 20 30 40
Draw Ratio
Fig. 6. Calculated stress-strain curves obtained for linear polyethylene (M = 475,000) at four different
values - indicated in graph - of the entanglement spacing factor 4 (see text).
Efect of Drawing Conditions
Experimental data (Capaccio et al., 1980; Kanamoto et al., 1988) seem to indicate
that, for each molecular weight, there exists an optimum drawing temperature and most
likely - because of time/temperature superposition principles - an optimum draw
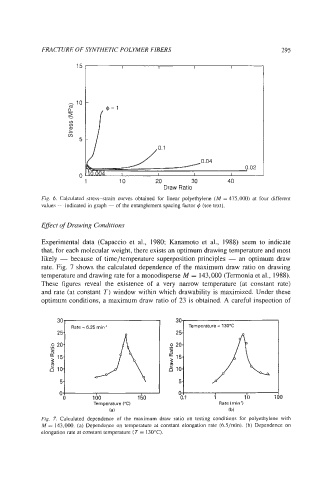
rate. Fig. 7 shows the calculated dependence of the maximum draw ratio on drawing
temperature and drawing rate for a monodisperse M = 143,000 (Termonia et al., 1988).
These figures reveal the existence of a very narrow temperature (at constant rate)
and rate (at constant T) window within which drawability is maximized. Under these
optimum conditions, a maximum draw ratio of 23 is obtained. A careful inspection of
25- Rate = 6.25 min-' I 301 Temperature = 130°C
.- 0 20.
c
m ,A
5 15.
E 10-
5-
0 0 1
0.1 1 10 1 0
Rate (min.')
(b)
Fig. 7, Calculated dependence of the maximum draw ratio on testing conditions for polyethylene with
M = 143,000. (a) Dependence on temperature at constant elongation rate (6.5/min). (b) Dependence on
elongation rate at constant temperature (T = 130°C).