
Page 316 - Fiber Fracture
P. 316
298 Y. Termonia
Strain %
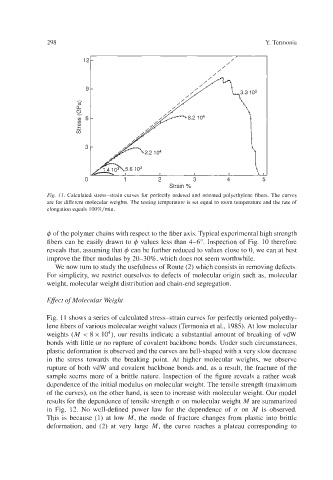
Fig. 11. Calculated stress-strain curves for perfectly ordered and oriented polyethylene fibers. The curves
are for different molecular weights. The testing temperature is set equal to room temperature and the rate of
elongation equals 100%/min.
4 of the polymer chains with respect to the fiber axis. Typical experimental high strength
fibers can be easily drawn to 4 values less than 4-6". Inspection of Fig. 10 therefore
reveals that, assuming that 4 can be further reduced to values close to 0, we can at best
improve the fiber modulus by 20-30%, which does not seem worthwhile.
We now turn to study the usefulness of Route (2) which consists in removing defects.
For simplicity, we restrict ourselves to defects of molecular origin such as, molecular
weight, molecular weight distribution and chain-end segregation.
Effect of Molecular Weight
Fig. 11 shows a series of calculated stress-strain curves for perfectly oriented polyethy-
lene fibers of various molecular weight values (Termonia et al., 1985). At low molecular
weights (M < 8 x lo4), our results indicate a substantial amount of breaking of vdW
bonds with little or no rupture of covalent backbone bonds. Under such circumstances,
plastic deformation is observed and the curves are bell-shaped with a very slow decrease
in the stress towards the breaking point. At higher molecular weights, we observe
rupture of both vdW and covalent backbone bonds and, as a result, the fracture of the
sample seems more of a brittle nature. Inspection of the figure reveals a rather weak
dependence of the initial modulus on molecular weight. The tensile strength (maximum
of the curves), on the other hand, is seen to increase with molecular weight. Our model
results for the dependence of tensile strength c on molecular weight M are summarized
in Fig. 12. No well-defined power law for the dependence of c on M is observed.
This is because (1) at low M, the mode of fracture changes from plastic into brittle
deformation, and (2) at very large M, the curve reaches a plateau corresponding to