
Page 314 - Fiber Fracture
P. 314
296 Y. Termonia
our model results of Fig. 7a reveals that, as the temperature of deformation is increased,
slippage of chains through entanglements sets in. That process leads to an effective
increase in the number n of statistical segments between entanglements and to an
increase in the draw ratio at break. However, at much higher temperatures T > 130°C
chain slippage becomes substantially faster than the elongation rate. As a result, chains
rapidly disentangle and drawability decreases. Further study reveals that, for every
molecular weight value, there exists an optimum temperature (or rate) window within
which drawability can be optimized. This, in turn, indicates that these effects will not be
observed for polydisperse molecular weights as every single chain length will have its
own optimum window which will be different from those for the other chains.
Eflect of Chain-Chain Interactions
All the results presented so far were for polyethylene for which chain-chain interactions
are limited to weak vdW interactions. We now turn to a study of the importance of
stronger chain-chain interactions, such as hydrogen bonds, on the chain drawability
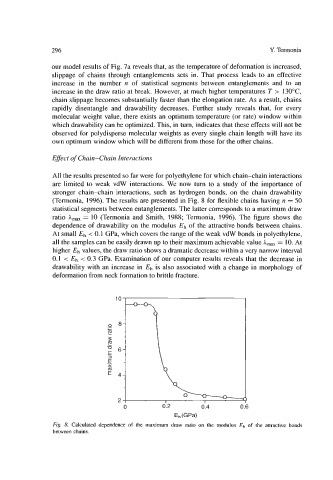
(Termonia, 1996). The results are presented in Fig. 8 for flexible chains having n = 50
statistical segments between entanglements. The latter corresponds to a maximum draw
ratio A, = 10 (Termonia and Smith, 1988; Termonia, 1996). The figure shows the
dependence of drawability on the modulus Eh of the attractive bonds between chains.
At small Eh < 0.1 GPa, which covers the range of the weak vdW bonds in polyethylene,
all the samples can be easily drawn up to their maximum achievable value Aimax = 10. At
higher Eh values, the draw ratio shows a dramatic decrease within a very narrow interval
0.1 < Eh < 0.3 GPa. Examination of our computer results reveals that the decrease in
drawability with an increase in Eh is also associated with a change in morphology of
deformation from neck formation to brittle fracture.
2 I I
0 0.2 0.4 0.6
Eh (GW
Fig. 8. Calculated dependence of the maximum draw ratio on the modulus & of the attractive bonds
between chains.