
Page 128 - Finance for Non-Financial Managers
P. 128
Siciliano07.qxd 3/20/2003 11:23 AM Page 109
The ratio that tracks that relationship, this time using the bal-
ance sheet information in Chapter 3, Figure 3-1, is computed
like this: Critical Performance Factors 109
Total Debt 1,267,000
Total Equity = 1,979,000 = 64% = .64:1
If a company has too much debt, there is risk that a small
reversal of fortunes may wipe out the owners’ equity entirely or
render the company unable to service its debt. While this by
itself may not sink a company, it puts extreme pressure on
management to return to profitability or invest more owners’
capital in the business.
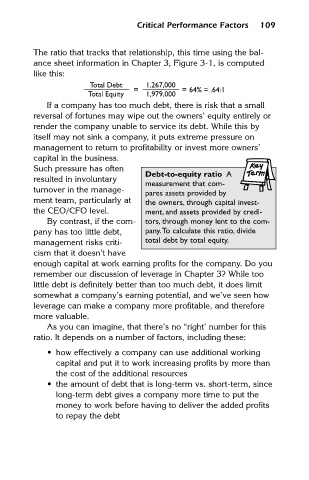
Such pressure has often
Debt-to-equity ratio A
resulted in involuntary
measurement that com-
turnover in the manage-
pares assets provided by
ment team, particularly at the owners, through capital invest-
the CEO/CFO level. ment, and assets provided by credi-
By contrast, if the com- tors, through money lent to the com-
pany has too little debt, pany.To calculate this ratio, divide
management risks criti- total debt by total equity.
cism that it doesn’t have
enough capital at work earning profits for the company. Do you
remember our discussion of leverage in Chapter 3? While too
little debt is definitely better than too much debt, it does limit
somewhat a company’s earning potential, and we’ve seen how
leverage can make a company more profitable, and therefore
more valuable.
As you can imagine, that there’s no “right’ number for this
ratio. It depends on a number of factors, including these:
• how effectively a company can use additional working
capital and put it to work increasing profits by more than
the cost of the additional resources
• the amount of debt that is long-term vs. short-term, since
long-term debt gives a company more time to put the
money to work before having to deliver the added profits
to repay the debt