
Page 410 - Fluid-Structure Interactions Slender Structure and Axial Flow (Volume 1)
P. 410
PIPES CONVEYING FLUID: NONLINEAR AND CHAOTIC DYNAMICS 385
0.2
0.1
- ....... ^..._.....
,..
2
-
2 0.0
2
a ...... ..I.-..-...
-0.1
*..“ ....... *^” .-.. ... - ... - . ... .....-*
-0.2
18 20 22 24 26 28
Flow velocity, u
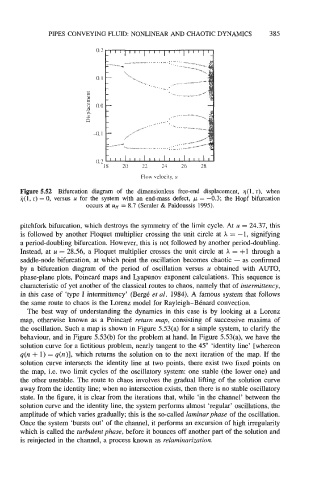
Figure 5.52 Bifurcation diagram of the dimensionless free-end displacement, q( 1, r), when
i(1, r) = 0, versus u for the system with an end-mass defect, p = -0.3; the Hopf bifurcation
occurs at uH = 8.7 (Semler & Pdidoussis 1995).
pitchfork bifurcation, which destroys the symmetry of the limit cycle. At u = 24.37, this
is followed by another Floquet multiplier crossing the unit circle at h = -1, signifying
a period-doubling bifurcation. However, this is not followed by another period-doubling.
Instead, at u = 28.56, a Floquet multiplier crosses the unit circle at h = +1 through a
saddle-node bifurcation, at which point the oscillation becomes chaotic - as confirmed
by a bifurcation diagram of the period of oscillation versus u obtained with AUTO,
phase-plane plots, PoincarC maps and Lyapunov exponent calculations. This sequence is
characteristic of yet another of the classical routes to chaos, namely that of intermittency,
in this case of ‘type I intermittency’ (Berg6 et al. 1984). A famous system that follows
the same route to chaos is the Lorenz model for Rayleigh-BCnard convection.
The best way of understanding the dynamics in this case is by looking at a Lorenz
map, otherwise known as a PoincarC return map, consisting of successive maxima of
the oscillation. Such a map is shown in Figure 5.53(a) for a simple system, to clarify the
behaviour, and in Figure 5.53(b) for the problem at hand. In Figure 5.53(a), we have the
solution curve for a fictitious problem, nearly tangent to the 45” ‘identity line’ [whereon
q(n + 1) = q(n)], which returns the solution on to the next iteration of the map. If the
solution curve intersects the identity line at two points, there exist two fixed points on
the map, i.e. two limit cycles of the oscillatory system: one stable (the lower one) and
the other unstable. The route to chaos involves the gradual lifting of the solution curve
away from the identity line; when no intersection exists, then there is no stable oscillatory
state. In the figure, it is clear from the iterations that, while ‘in the channel’ between the
solution curve and the identity line, the system performs almost ‘regular’ oscillations, the
amplitude of which varies gradually; this is the so-called laminar phase of the oscillation.
Once the system ‘bursts out’ of the channel, it performs an excursion of high irregularity
which is called the turbulent phase, before it bounces off another part of the solution and
is reinjected in the channel, a process known as relaminarization.