Page 405 - Fluid-Structure Interactions Slender Structure and Axial Flow (Volume 1)
P. 405

PIPES CONVEYING FLUID: NONLINEAR AND CHAOTIC DYNAMICS          381

      unlike the period-doubling route, this route to chaos involves a finite and small number
      of  bifurcations.
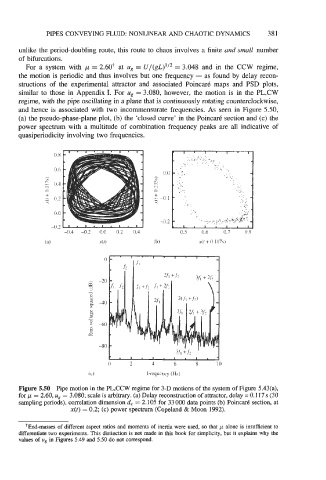
        For  a  system with  p = 2.60t  at  ug = U/(gL)1/2 = 3.048  and  in  the  CCW regime,
      the motion is periodic and thus involves but one frequency - as found by  delay recon-
      structions of  the  experimental attractor and  associated Poincare maps  and PSD  plots,
      similar to those in  Appendix I. For  ug = 3.080, however, the motion is in the PL,CW
      regime, with the pipe oscillating in a plane that is continuously rotating counterclockwise,
      and hence is associated with two incommensurate frequencies. As  seen in Figure 5.50,
      (a) the pseudo-phase-plane plot, (b) the 'closed curve' in the Poincark section and (c) the
      power spectrum with a multitude of  combination frequency peaks are all indicative of
      quasiperiodicity involving two frequencies.

                                                                  I  .
                                                  h   1  .  1  .
                                                      ..  : . ..
                0.8                               -   , *~, : , .',:  :  ?  : _. ' .
                                                          ..
                                                      ..
                                                      ..:  :.,'."..;.,. ..*.
                                                             .:
                                                              .:..  . . .
                                                              .. .. .
                0.6                             0.0  -...;.:.  ._/  .   .I..  .  ,:  ;
                                                                  .. .
                                                                   ..
              v1
              h                              h      _.           .., ..
                                                                    _.
                                             m
                0.4                          vl     .  ..           ..
                                                                    ..
              0                              2       :,.  ..        ..;,  ...
                                                                     , .'
              2  0.2                           -0.1   -  :._          . r .,.
                                                                      i.
                                             R       . ..             ",:'
                                                        ..
                                                                       .. . .
                                                       .. .           :-,:.
                0.0                                    . ..        . . ..I  ..
                                               -0.2  -   '  .. .L..;.   ;.,-...+.?,;~:%;-."
                                                                     ':...e&
                                                            ...__ .
                -0.2                              D  l  .  1  .  I  .  I
                          h  -20
                          !2
                          a
                           2
                           3  -40
                           sr
                          -
                           4
                           I
                           g  -60
                           E
                          e:
                             -80
                                0     2     4      6     8     10
                          (C)              Frequency (Hz)
      Figure 5.50  Pipe motion in the PL,CCW regime for 3-D motions of  the system of Figure 5.43(a),
      for p = 2.60, ug = 3.080; scale is arbitrary. (a) Delay reconstruction of attractor, delay = 0.1 17 s (30
      sampling periods), correlation dimension d, = 2.105 for 33 0oO data points (b) Poincan5 section, at
                     x(t) = 0.2; (c) power spectrum (Copeland & Moon 1992).
        +End-masses of different aspect ratios and moments of inertia were used, so that  p alone is insufficient to
      differentiate two experiments. This distinction is not made in this book for simplicity, but it explains why the
      values of up in Figures 5.49 and 5.50 do not correspond.
   400   401   402   403   404   405   406   407   408   409   410