
Page 530 - Forensic Structural Engineering Handbook
P. 530
14.20 MATERIAL-SPECIFIC FORENSIC ANALYSES
than the expected failure value when you consider the temperature of 135°F above the dryer
and a 1.15 duration of load factor. Using our example of 27,000 lb assumed for tension:
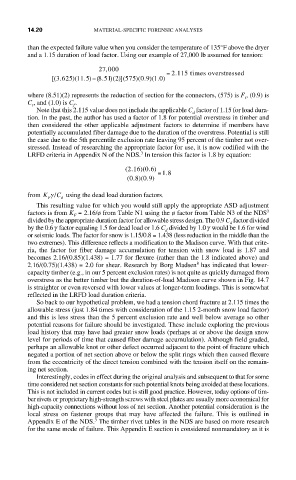
,
27 000
= 22.115 times overstressed
. )
)]
( [ 3 625 11 5)−( 8 51 2 575 0 9 1 0)
.
)(
.
.
.
)(
)(
(
(
where (8.51)(2) represents the reduction of section for the connectors, (575) is F , (0.9) is
t
C , and (1.0) is C .
t f
Note that this 2.115 value does not include the applicable C factor of 1.15 for load dura-
d
tion. In the past, the author has used a factor of 1.8 for potential overstress in timber and
then considered the other applicable adjustment factors to determine if members have
potentially accumulated fiber damage due to the duration of the overstress. Potential is still
the case due to the 5th percentile exclusion rate leaving 95 percent of the timber not over-
stressed. Instead of researching the appropriate factor for use, it is now codified with the
3
LRFD criteria in Appendix N of the NDS. In tension this factor is 1.8 by equation:
06
(.216 )(. )
= . 18
09
08
(. )(. )
from K γ/ C using the dead load duration factors.
F d
This resulting value for which you would still apply the appropriate ASD adjustment
factors is from K = 2.16/ø from Table N1 using the ø factor from Table N3 of the NDS 3
F
divided by the appropriate duration factor for allowable stress design. The 0.9 C factor divided
d
by the 0.6g factor equaling 1.5 for dead load or 1.6 C divided by 1.0g would be 1.6 for wind
d
or seismic loads. The factor for snow is 1.15/0.8 = 1.438 (less reduction in the middle than the
two extremes). This difference reflects a modification to the Madison curve. With that crite-
ria, the factor for fiber damage accumulation for tension with snow load is 1.87 and
becomes 2.16/(0.85)(1.438) = 1.77 for flexure (rather than the 1.8 indicated above) and
8
2.16/(0.75)(1.438) = 2.0 for shear. Research by Borg Madsen has indicated that lower-
capacity timber (e.g., in our 5 percent exclusion rates) is not quite as quickly damaged from
overstress as the better timber but the duration-of-load Madison curve shown in Fig. 14.7
is straighter or even reversed with lower values at longer-term loadings. This is somewhat
reflected in the LRFD load duration criteria.
So back to our hypothetical problem, we had a tension chord fracture at 2.115 times the
allowable stress (just 1.84 times with consideration of the 1.15 2-month snow load factor)
and this is less stress than the 5 percent exclusion rate and well below average so other
potential reasons for failure should be investigated. These include exploring the previous
load history that may have had greater snow loads (perhaps at or above the design snow
level for periods of time that caused fiber damage accumulation). Although field graded,
perhaps an allowable knot or other defect occurred adjacent to the point of fracture which
negated a portion of net section above or below the split rings which then caused flexure
from the eccentricity of the direct tension combined with the tension itself on the remain-
ing net section.
Interestingly, codes in effect during the original analysis and subsequent to that for some
time considered net section constants for such potential knots being avoided at these locations.
This is not included in current codes but is still good practice. However, today options of tim-
ber rivets or proprietary high-strength screws with steel plates are usually more economical for
high-capacity connections without loss of net section. Another potential consideration is the
local stress on fastener groups that may have affected the failure. This is outlined in
3
Appendix E of the NDS. The timber rivet tables in the NDS are based on more research
for the same mode of failure. This Appendix E section is considered nonmandatory as it is