
Page 191 - Subyek Teknik Mesin - Forsthoffers Best Practice Handbook for Rotating Machinery by William E Forsthoffer
P. 191
Compressor Best Practices Best Practice 3 .15
Surge is a high speed phenomenon. Flow reversals can occur in
less than 150 milliseconds
Reversal rate is 30 to 120 cycles/sec
Pressure rapidly fluctuates
Noise generated
Temperature increase (can be rapid)
Mechanical damage can occur
Unit may trip
Intensity varies with the application
Fig 3.15.1 Surge facts
are not spared, this can cause a significant loss of revenue.
Typical daily product revenues for a world class process unit can
exceed US$1,000,000 per day! Figure 3.15.1 shows some of the
most common effects of surge.
Of all the effects listed, by far the most damaging is the rapid
temperature increase, since this can cause internal rubs of the
compressor at operating speed, resulting in impeller breakage, Fig 3.15.3 The surge phenomena
diaphragm breakage, extreme labyrinth seal wear and possible
case breakage.
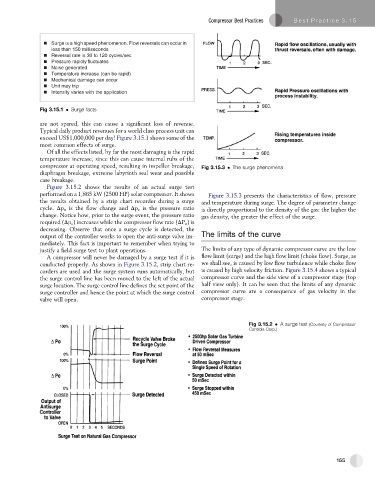
Figure 3.15.2 shows the results of an actual surge test
performed on a 1,865 kW (2500 HP) solar compressor. It shows Figure 3.15.3 presents the characteristics of flow, pressure
the results obtained by a strip chart recorder during a surge and temperature during surge. The degree of parameter change
cycle. Dp o is the flow change and Dp c is the pressure ratio is directly proportional to the density of the gas: the higher the
change. Notice how, prior to the surge event, the pressure ratio gas density, the greater the effect of the surge.
required (Dp c ) increases while the compressor flow rate (DP o )is
decreasing. Observe that once a surge cycle is detected, the
output of the controller works to open the anti-surge valve im- The limits of the curve
mediately. This fact is important to remember when trying to
justify a field surge test to plant operations. The limits of any type of dynamic compressor curve are the low
A compressor will never be damaged by a surge test if it is flow limit (surge) and the high flow limit (choke flow). Surge, as
conducted properly. As shown in Figure 3.15.2, strip chart re- we shall see, is caused by low flow turbulence while choke flow
corders are used and the surge system runs automatically, but is caused by high velocity friction. Figure 3.15.4 shows a typical
the surge control line has been moved to the left of the actual compressor curve and the side view of a compressor stage (top
surge location. The surge control line defines the set point of the half view only). It can be seen that the limits of any dynamic
surge controller and hence the point at which the surge control compressor curve are a consequence of gas velocity in the
valve will open. compressor stage.
Fig 3.15.2 A surge test (Courtesy of Compressor
Controls Corp.)
165