
Page 266 - T. Anderson-Fracture Mechanics - Fundamentals and Applns.-CRC (2005)
P. 266
1656_C005.fm Page 246 Monday, May 23, 2005 5:47 PM
246 Fracture Mechanics: Fundamentals and Applications
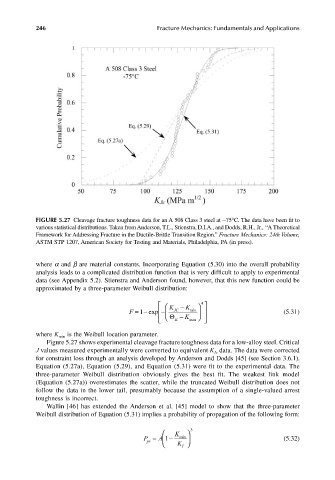
FIGURE 5.27 Cleavage fracture toughness data for an A 508 Class 3 steel at −75°C. The data have been fit to
various statistical distributions. Taken from Anderson, T.L., Stienstra, D.I.A., and Dodds, R.H., Jr., ‘‘A Theoretical
Framework for Addressing Fracture in the Ductile-Brittle Transition Region.” Fracture Mechanics: 24th Volume,
ASTM STP 1207, American Society for Testing and Materials, Philadelphia, PA (in press).
where α and β are material constants. Incorporating Equation (5.30) into the overall probability
analysis leads to a complicated distribution function that is very difficult to apply to experimental
data (see Appendix 5.2). Stienstra and Anderson found, however, that this new function could be
approximated by a three-parameter Weibull distribution:
K − K 4
1
F =− exp − JC min (5.31)
Θ K − K min
where K is the Weibull location parameter.
min
Figure 5.27 shows experimental cleavage fracture toughness data for a low-alloy steel. Critical
J values measured experimentally were converted to equivalent K data. The data were corrected
Ic
for constraint loss through an analysis developed by Anderson and Dodds [45] (see Section 3.6.1).
Equation (5.27a), Equation (5.29), and Equation (5.31) were fit to the experimental data. The
three-parameter Weibull distribution obviously gives the best fit. The weakest link model
(Equation (5.27a)) overestimates the scatter, while the truncated Weibull distribution does not
follow the data in the lower tail, presumably because the assumption of a single-valued arrest
toughness is incorrect.
Wallin [46] has extended the Anderson et al. [45] model to show that the three-parameter
Weibull distribution of Equation (5.31) implies a probability of propagation of the following form:
K 3
P pr A = 1 − K (5.32)
min
I