Page 438 - T. Anderson-Fracture Mechanics - Fundamentals and Applns.-CRC (2005)
P. 438
1656_C009.fm Page 418 Monday, May 23, 2005 3:58 PM
418 Fracture Mechanics: Fundamentals and Applications
tension (MT) specimen (Figure 7.1d). When the applied load is normalized by the yield load P o
on the x axis, the resulting FAD curves depend on the relative crack length.
Recently, an alternative approach for normalizing the x axis of the FAD was proposed [36].
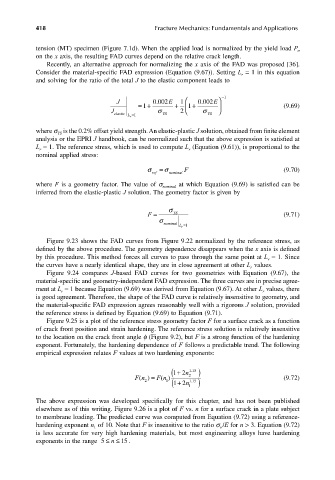
Consider the material-specific FAD expression (Equation (9.67)). Setting L = 1 in this equation
r
and solving for the ratio of the total J to the elastic component leads to
J =+ 0 002 E + 1 + 0 002 E −1
.
.
J 1 σ 2 1 σ YS (9.69)
elastic L r =1 YS
where s is the 0.2% offset yield strength. An elastic-plastic J solution, obtained from finite element
YS
analysis or the EPRI J handbook, can be normalized such that the above expression is satisfied at
L = 1. The reference stress, which is used to compute L (Equation (9.61)), is proportional to the
r
r
nominal applied stress:
σ ref = σ nominal F (9.70)
where F is a geometry factor. The value of s nominal at which Equation (9.69) is satisfied can be
inferred from the elastic-plastic J solution. The geometry factor is given by
σ
F = YS (9.71)
σ
nominal
L r =1
Figure 9.23 shows the FAD curves from Figure 9.22 normalized by the reference stress, as
defined by the above procedure. The geometry dependence disappears when the x axis is defined
by this procedure. This method forces all curves to pass through the same point at L = 1. Since
r
the curves have a nearly identical shape, they are in close agreement at other L values.
r
Figure 9.24 compares J-based FAD curves for two geometries with Equation (9.67), the
material-specific and geometry-independent FAD expression. The three curves are in precise agree-
ment at L = 1 because Equation (9.69) was derived from Equation (9.67). At other L values, there
r
r
is good agreement. Therefore, the shape of the FAD curve is relatively insensitive to geometry, and
the material-specific FAD expression agrees reasonably well with a rigorous J solution, provided
the reference stress is defined by Equation (9.69) to Equation (9.71).
Figure 9.25 is a plot of the reference stress geometry factor F for a surface crack as a function
of crack front position and strain hardening. The reference stress solution is relatively insensitive
to the location on the crack front angle f (Figure 9.2), but F is a strong function of the hardening
exponent. Fortunately, the hardening dependence of F follows a predictable trend. The following
empirical expression relates F values at two hardening exponents:
+ ( n ) . 115
12
Fn() = Fn ) 2 (9.72)
(
2 1 + ( n ) . 115
12
1
The above expression was developed specifically for this chapter, and has not been published
elsewhere as of this writing. Figure 9.26 is a plot of F vs. n for a surface crack in a plate subject
to membrane loading. The predicted curve was computed from Equation (9.72) using a reference-
hardening exponent n of 10. Note that F is insensitive to the ratio s /E for n > 3. Equation (9.72)
o
1
is less accurate for very high hardening materials, but most engineering alloys have hardening
exponents in the range 5 ≤≤n 15 .

