Page 433 - T. Anderson-Fracture Mechanics - Fundamentals and Applns.-CRC (2005)
P. 433

1656_C009.fm  Page 413  Monday, May 23, 2005  3:58 PM


                       Application to Structures                                                   413


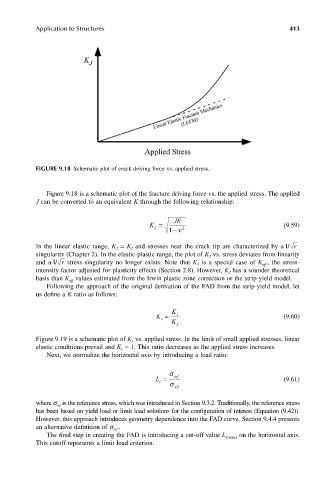
                       FIGURE 9.18 Schematic plot of crack driving force vs. applied stress.


                          Figure 9.18 is a schematic plot of the fracture driving force vs. the applied stress. The applied
                       J can be converted to an equivalent K through the following relationship:

                                                                JE
                                                         K =                                     (9.59)
                                                          J
                                                               1 −ν 2
                       In the linear elastic range, K   =  K  and stresses near the crack tip are characterized by a 1/ r
                                               J
                                                   I
                       singularity (Chapter 2). In the elastic-plastic range, the plot of K  vs. stress deviates from linearity
                                                                           J
                       and a 1/ r  stress singularity no longer exists. Note that  K  is a special case of  K , the stress-
                                                                       J
                                                                                           eff
                       intensity factor adjusted for plasticity effects (Section 2.8). However, K  has a sounder theoretical
                                                                                J
                       basis than K  values estimated from the Irwin plastic zone correction or the strip-yield model.
                                 eff
                          Following the approach of the original derivation of the FAD from the strip-yield model, let
                       us define a K ratio as follows:
                                                               K
                                                           K =  K I J                            (9.60)
                                                            r
                       Figure 9.19 is a schematic plot of K  vs. applied stress. In the limit of small applied stresses, linear
                                                   r
                       elastic conditions prevail and K  = 1. This ratio decreases as the applied stress increases.
                                                r
                          Next, we normalize the horizontal axis by introducing a load ratio:
                                                               σ
                                                           L =  σ ref                            (9.61)
                                                            r
                                                                YS

                       where s  is the reference stress, which was introduced in Section 9.3.2. Traditionally, the reference stress
                             ref
                       has been based on yield load or limit load solutions for the configuration of interest (Equation (9.42)).
                       However, this approach introduces geometry dependence into the FAD curve. Section 9.4.4 presents
                       an alternative definition of s .
                                              ref
                          The final step in creating the FAD is introducing a cut-off value L r(max)  on the horizontal axis.
                       This cutoff represents a limit load criterion.
   428   429   430   431   432   433   434   435   436   437   438