
Page 431 - T. Anderson-Fracture Mechanics - Fundamentals and Applns.-CRC (2005)
P. 431
1656_C009.fm Page 411 Monday, May 23, 2005 3:58 PM
Application to Structures 411
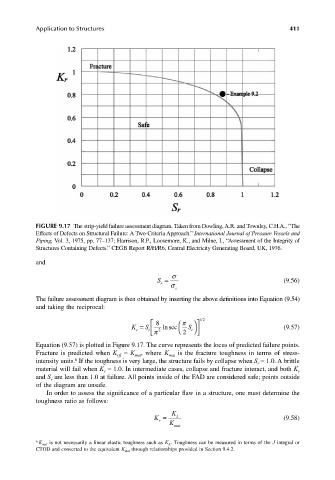
FIGURE 9.17 The strip-yield failure assessment diagram. Taken from Dowling, A.R. and Townley, C.H.A., “The
Effects of Defects on Structural Failure: A Two-Criteria Approach.” International Journal of Pressure Vessels and
Piping, Vol. 3, 1975, pp. 77–137; Harrison, R.P., Loosemore, K., and Milne, I., “Assessment of the Integrity of
Structures Containing Defects.” CEGB Report R/H/R6, Central Electricity Generating Board, UK, 1976.
and
σ
S = σ c (9.56)
r
The failure assessment diagram is then obtained by inserting the above definitions into Equation (9.54)
and taking the reciprocal:
K r S = r 8 2 lnsec π S r 12 / (9.57)
π
2
Equation (9.57) is plotted in Figure 9.17. The curve represents the locus of predicted failure points.
Fracture is predicted when K = K , where K is the fracture toughness in terms of stress-
eff
mat
mat
6
intensity units. If the toughness is very large, the structure fails by collapse when S = 1.0. A brittle
r
material will fail when K = 1.0. In intermediate cases, collapse and fracture interact, and both K r
r
and S are less than 1.0 at failure. All points inside of the FAD are considered safe; points outside
r
of the diagram are unsafe.
In order to assess the significance of a particular flaw in a structure, one must determine the
toughness ratio as follows:
K
I
K = K mat (9.58)
r
6 K mat is not necessarily a linear elastic toughness such as K Ic . Toughness can be measured in terms of the J integral or
CTOD and converted to the equivalent K mat through relationships provided in Section 9.4.2.