
Page 426 - T. Anderson-Fracture Mechanics - Fundamentals and Applns.-CRC (2005)
P. 426
1656_C009.fm Page 406 Monday, May 23, 2005 3:58 PM
406 Fracture Mechanics: Fundamentals and Applications
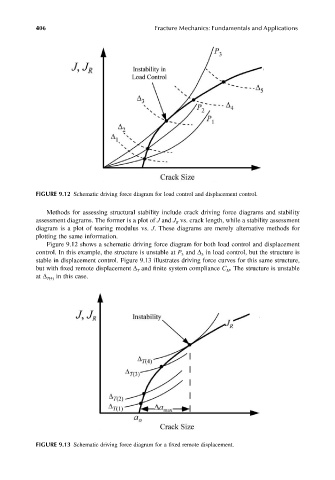
FIGURE 9.12 Schematic driving force diagram for load control and displacement control.
Methods for assessing structural stability include crack driving force diagrams and stability
assessment diagrams. The former is a plot of J and J vs. crack length, while a stability assessment
R
diagram is a plot of tearing modulus vs. J. These diagrams are merely alternative methods for
plotting the same information.
Figure 9.12 shows a schematic driving force diagram for both load control and displacement
control. In this example, the structure is unstable at P and ∆ in load control, but the structure is
3
3
stable in displacement control. Figure 9.13 illustrates driving force curves for this same structure,
but with fixed remote displacement ∆ and finite system compliance C . The structure is unstable
M
T
at ∆ T(4) in this case.
FIGURE 9.13 Schematic driving force diagram for a fixed remote displacement.