
Page 427 - T. Anderson-Fracture Mechanics - Fundamentals and Applns.-CRC (2005)
P. 427
1656_C009.fm Page 407 Monday, May 23, 2005 3:58 PM
Application to Structures 407
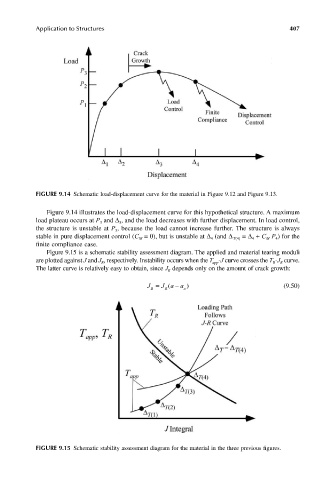
FIGURE 9.14 Schematic load-displacement curve for the material in Figure 9.12 and Figure 9.13.
Figure 9.14 illustrates the load-displacement curve for this hypothetical structure. A maximum
load plateau occurs at P and ∆ , and the load decreases with further displacement. In load control,
3
3
the structure is unstable at P , because the load cannot increase further. The structure is always
3
stable in pure displacement control (C = 0), but is unstable at ∆ (and ∆ T(4) = ∆ + C P ) for the
M
M
4
4
4
finite compliance case.
Figure 9.15 is a schematic stability assessment diagram. The applied and material tearing moduli
are plotted against J and J , respectively. Instability occurs when the T -J curve crosses the T -J curve.
app
R
R
R
The latter curve is relatively easy to obtain, since J depends only on the amount of crack growth:
R
J R J = R ( a a − o ) (9.50)
FIGURE 9.15 Schematic stability assessment diagram for the material in the three previous figures.