Page 432 - T. Anderson-Fracture Mechanics - Fundamentals and Applns.-CRC (2005)
P. 432
1656_C009.fm Page 412 Monday, May 23, 2005 3:58 PM
412 Fracture Mechanics: Fundamentals and Applications
The stress ratio for the component of interest can be defined as the ratio of the applied stress to
the collapse stress. Alternatively, the applied S can be defined in terms of axial forces or moments.
r
If the assessment point with coordinates (S , K ) falls inside of the FAD curve, the analysis predicts
r
r
that the component is safe.
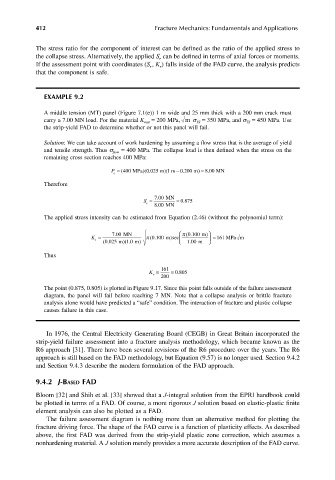
EXAMPLE 9.2
A middle tension (MT) panel (Figure 7.1(e)) 1 m wide and 25 mm thick with a 200 mm crack must
carry a 7.00 MN load. For the material K mat = 200 MPa, m s YS = 350 MPa, and s TS = 450 MPa. Use
the strip-yield FAD to determine whether or not this panel will fail.
Solution: We can take account of work hardening by assuming a flow stress that is the average of yield
and tensile strength. Thus s flow = 400 MPa. The collapse load is then defined when the stress on the
remaining cross section reaches 400 MPa:
P = c )(1 m − (400 MPa . 0 200 m ) 8 .00 MN
= )( . 0 025 m
Therefore
.
S = r 700 MN = 0 875
.
.
800 MN
The applied stress intensity can be estimated from Equation (2.46) (without the polynomial term):
π
0
.
K = 700 MN π ( 0 100 m )sec (.100 m ) = 161 MPa m
.
I
(. m )( 1 0 m ) 100 m
.
.
0 025
Thus
K = r 161 = 0 805
.
200
The point (0.875, 0.805) is plotted in Figure 9.17. Since this point falls outside of the failure assessment
diagram, the panel will fail before reaching 7 MN. Note that a collapse analysis or brittle fracture
analysis alone would have predicted a “safe” condition. The interaction of fracture and plastic collapse
causes failure in this case.
In 1976, the Central Electricity Generating Board (CEGB) in Great Britain incorporated the
strip-yield failure assessment into a fracture analysis methodology, which became known as the
R6 approach [31]. There have been several revisions of the R6 procedure over the years. The R6
approach is still based on the FAD methodology, but Equation (9.57) is no longer used. Section 9.4.2
and Section 9.4.3 describe the modern formulation of the FAD approach.
9.4.2 J-BASED FAD
Bloom [32] and Shih et al. [33] showed that a J-integral solution from the EPRI handbook could
be plotted in terms of a FAD. Of course, a more rigorous J solution based on elastic-plastic finite
element analysis can also be plotted as a FAD.
The failure assessment diagram is nothing more than an alternative method for plotting the
fracture driving force. The shape of the FAD curve is a function of plasticity effects. As described
above, the first FAD was derived from the strip-yield plastic zone correction, which assumes a
nonhardening material. A J solution merely provides a more accurate description of the FAD curve.

